Most founders know they should explain how their invention works. Fewer know how to show it in a way that is easy to follow.
That is where flowcharts help.
A good flowchart can turn a long block of text into something clear, visual, and much easier to understand. In a patent spec, that matters a lot. It helps tell the story of your system, your method, your software flow, and the steps that make your invention different.
If you are building fast and want a better way to protect what you are making, see how PowerPatent helps founders turn technical work into strong patent filings with smart software and real attorney guidance: https://powerpatent.com/how-it-works
Why flowcharts matter so much in a patent spec
A patent spec is not just a place to dump facts. It is where you teach someone how your invention works. You are painting a full picture. You are showing the parts, the steps, the paths, the options, and the result.
Text does a lot of that work. But text alone can get crowded fast.
That is especially true in software, AI, robotics, data systems, control systems, fintech tools, biotech platforms, and anything else where the invention is not just one object sitting still. Many inventions move. They react. They take input, process it, make choices, and produce output. A flowchart is the natural way to show that movement.
A strong flowchart helps in three big ways.
First, it helps the reader understand the invention faster. That reader may be a patent examiner. It may be an investor doing diligence later. It may be a buyer, a partner, a court, or your own team coming back to the filing months later. A good diagram lowers friction. It lets the reader see the path instead of guessing at it.
Second, it helps support your claims. A patent is not won by pretty pictures. But a clear figure can back up the words in your spec. It can make your written disclosure stronger because it ties the steps together in a visible way.
Third, it helps you think better while drafting. This is the part many founders miss. The act of making a flowchart often reveals holes in the invention story. You notice missing steps. You see choices you forgot to describe. You spot an edge case. You realize there are two versions of the process, not one. That kind of clarity can save you from filing too soon with a thin draft.
In plain words, flowcharts are not decoration. They are thinking tools. They are drafting tools. They are protection tools.
That is one reason many startup teams now want a smarter drafting process from the start. Instead of wrestling with scattered notes, screenshots, and long email chains, they want a system that helps turn technical detail into clean patent-ready material. PowerPatent was built for exactly that kind of founder workflow, combining software speed with real attorney oversight so you can move fast without making costly mistakes: https://powerpatent.com/how-it-works
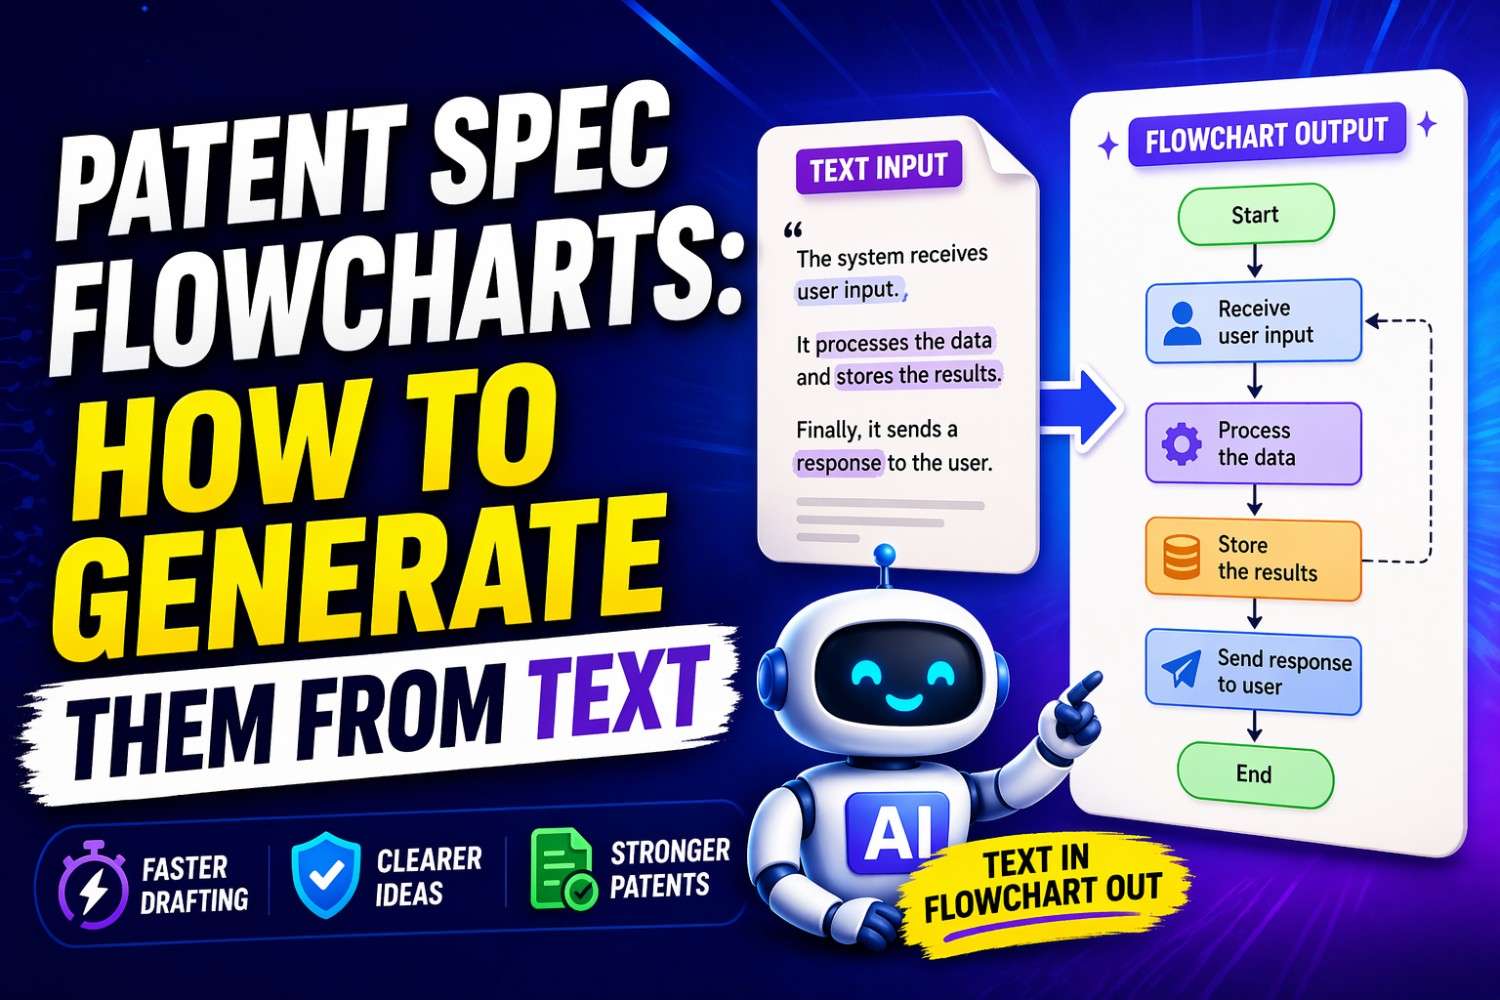
What a patent spec flowchart actually is
A patent spec flowchart is a visual drawing that shows how a process works, step by step.
That process might be a method your software performs. It might be the way data moves through a system. It might be how a device reacts to a signal. It might be how a model is trained, how a request is handled, how a user is verified, how an output is generated, or how an action is triggered.
The key point is this: a flowchart shows sequence and logic.
It often answers questions like these:
What happens first?
What happens next?
What choices are made along the way?
What happens if condition A is true?
What happens if condition B is false?
What is optional?
What loops back?
What ends the process?
In patent drawings, flowcharts often use simple blocks and arrows. One block may show a step like “receive sensor data.” Another block may show “normalize data values.” A decision shape may show “does value exceed threshold?” The arrow tells you where the process goes next.
That sounds simple, because it is. But simple is good. The point is not to impress. The point is to make the invention easy to follow and broad enough to support useful patent coverage.
A common mistake is assuming the flowchart must capture every tiny technical detail. It does not. It should show enough detail to support the written disclosure, but not so much that it becomes messy, narrow, or hard to read.
Think of it like this. The written spec tells the full story in words. The flowchart shows the skeleton of that story in a visual form.
Why founders struggle to create flowcharts from text
Most inventors do not struggle because they lack ideas. They struggle because their ideas live in forms that are not flowchart-ready.
The invention may exist as product docs, code comments, whiteboard photos, Slack threads, architecture notes, demo scripts, model cards, tickets, notebooks, or mental models shared by the team. All of that may be accurate. None of it is naturally clean.
Text about an invention is often messy in at least one of these ways.
It may be too detailed. It includes every engineering choice, every exception, every implementation note, and every historical reason for why the team built it that way.
It may be too vague. It says things like “the system processes the request and returns a result” without explaining what happens in between.
It may be out of order. The real process might start with identity checks and feature extraction, but the write-up starts with result ranking because that is what the engineer was thinking about that day.
It may mix many flows together. The normal path, the fallback path, the training flow, the deployment flow, and the admin flow all get packed into one giant block of prose.
It may depend on knowledge that is not written down. A founder might say, “well of course it also logs the event and checks permissions first.” But if that is not in the draft, no reader can assume it.
This is why “generate a flowchart from text” is harder than it sounds. The work is not mostly drawing. The hard part is extracting structure.
You are taking unshaped explanation and converting it into a sequence of meaningful steps. That is a thinking job before it becomes a design job.
And in patent work, that matters even more because you are not just making a slide for a product review. You are creating part of a legal document. The flowchart must align with the written disclosure. It must support the invention story. It must avoid accidental narrowing. It must be clear without boxing you into one tiny implementation.
That is why the right process matters more than the drawing tool.
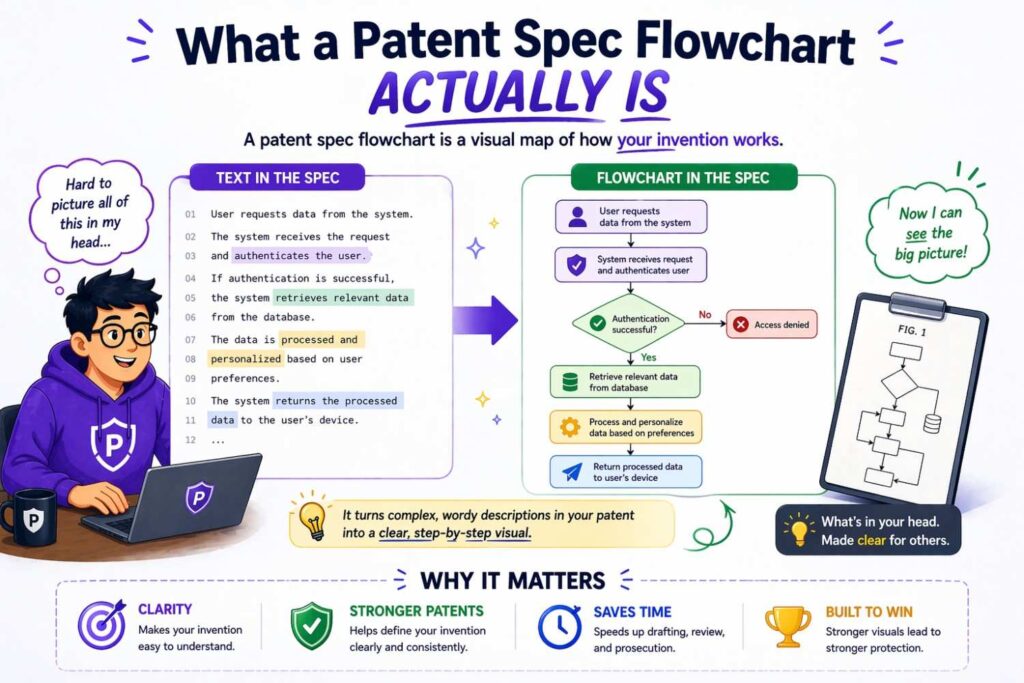
Start with the right goal
Before you turn text into a flowchart, decide what that flowchart is meant to do.
This sounds obvious, but many weak patent figures begin with no clear goal. Someone grabs a chunk of text, starts drawing boxes, and ends up with a diagram that is crowded, narrow, and hard to use.
A better question is this: what exact invention story should this figure tell?
There are several good answers.
You may want to show the core method of operation. This is the classic patent flowchart. It shows the main steps of the invention from start to finish.
You may want to show a decision process. This works well when the invention makes rule-based choices, routes inputs, scores candidates, filters actions, or triggers outcomes based on one or more conditions.
You may want to show a training or setup process. This is common in AI, machine learning, calibration systems, provisioning workflows, and systems that build internal models before runtime.
You may want to show a runtime process. This is often separate from training or setup. It answers the question: what happens when the system is live and receives a real input?
You may want to show a fallback or alternate branch. Many strong patent specs do this well. They do not act as if the system only works in ideal conditions. They show that there are different routes and options.
You may want to show interaction among system parts. This may blur into a block diagram, but sometimes a flowchart can still help by showing the sequence of inter-part actions.
The goal shapes the figure. If you are trying to show the core method, you may want a clean straight path with limited side branches. If you are trying to show a decision process, you may need more branching. If you are trying to show both training and runtime in one figure, you may decide that is too much and split it into two.
That last move is often the right one.
Many founders try to cram too much into a single flowchart because they think one big figure looks more complete. In reality, one focused figure is often more powerful than one overloaded figure. More is not always better. Clear is better.
The raw material: what text should you use
You do not need a perfect patent draft to begin. You just need enough text to extract a process.
That text can come from many places.
It may be a product requirement document that describes how a feature works.
It may be a technical memo written by the engineer who built the system.
It may be a founder note that explains the problem, the approach, and the steps.
It may be a claim draft, although claim language alone is usually too compressed to create the best figure.
It may be a design review deck.
It may be a recording transcript from a founder or inventor walking through the invention in plain words.
It may even be code comments paired with architecture notes.
The best source text usually has three things.
It describes inputs.
It describes actions or transformations.
It describes outputs or outcomes.
That gives you a beginning, middle, and end. Once you have that, you can usually build a basic flow.
But there is a deeper point here. The most useful source text is often not the most polished text. It is the text that captures how the inventor really thinks about the invention.
Founders sometimes worry that their notes are too rough. In many cases, rough notes are fine. They may even be better than polished marketing copy because they contain the real substance of what the system is doing.
This is where a smart workflow helps. You want a process that captures the inventor’s real technical explanation and then helps shape it into patent-ready structure. That is exactly the kind of gap PowerPatent helps close. It gives startup teams a faster, cleaner path from invention details to strong filing material, while still keeping real patent attorneys in the loop where it counts: https://powerpatent.com/how-it-works
The simplest framework for turning text into a flowchart
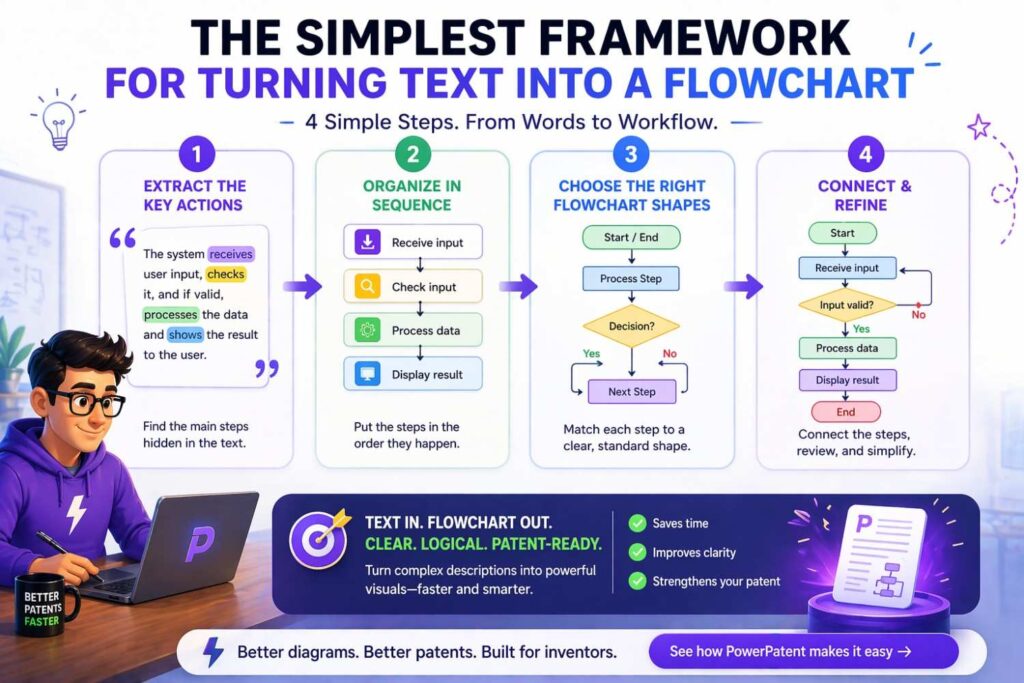
If you want to generate a flowchart from text without making it a mess, use a simple mental model.
Read the text and pull out five things.
Find the trigger.
Find the main steps.
Find the decisions.
Find the outputs.
Find the alternate paths.
That is the whole game.
The trigger is what starts the process. This might be receiving a request, collecting data, detecting an event, opening a file, starting a training cycle, or getting user input.
The main steps are the core actions. These are usually verbs. Receive. Parse. Extract. Compare. Rank. Generate. Update. Store. Transmit. Display.
The decisions are places where the process changes based on a condition. Does the user pass validation? Does confidence exceed a threshold? Is the signal strong enough? Does the model output match a stored profile?
The outputs are what comes out of the process. A decision result. A generated recommendation. A control signal. A score. A ranked list. An alert. A trained model. An authenticated session.
The alternate paths are the branches and options. Retry. Reject. Loop back. Use a fallback model. Trigger a second pass. Store for later review. Route to a human.
Once you extract those five things, the flowchart becomes much easier.
You are no longer staring at a wall of text.
You are working with a sequence.
A practical example from plain text
Let us say the source text says this:
A system receives transaction data from a user device. The system extracts a set of behavior features, compares the features to a stored fraud pattern model, generates a fraud score, and determines whether the score exceeds a threshold.
If the score exceeds the threshold, the system blocks the transaction and generates an alert. If the score does not exceed the threshold, the system approves the transaction and logs the result. In some cases, the system may request additional verification before approving the transaction.
That is already decent source text. Now watch how it becomes flowchart-ready.
The trigger is receiving transaction data.
The main steps are extracting behavior features, comparing features to a fraud model, generating a fraud score, and determining whether the score exceeds a threshold.
The outputs are transaction block plus alert, or transaction approval plus log.
The alternate path is additional verification before approval.
Now the flowchart could look like this in plain words:
Start with receiving transaction data.
Move to extracting behavior features.
Move to comparing features to the stored fraud pattern model.
Move to generating the fraud score.
Move to determining whether the fraud score exceeds a threshold.
If yes, block the transaction and generate an alert.
If no, determine whether additional verification is required.
If yes, request additional verification and then approve or reject based on the result.
If no, approve the transaction and log the result.
That is already cleaner than the paragraph.
And once you have that sequence, drawing it is easy.
This example also shows something important. The text and flowchart do not need to be identical word for word. They need to match in substance. The flowchart is a visual expression of the same disclosure.
How to read text like a patent drafter, not just a designer
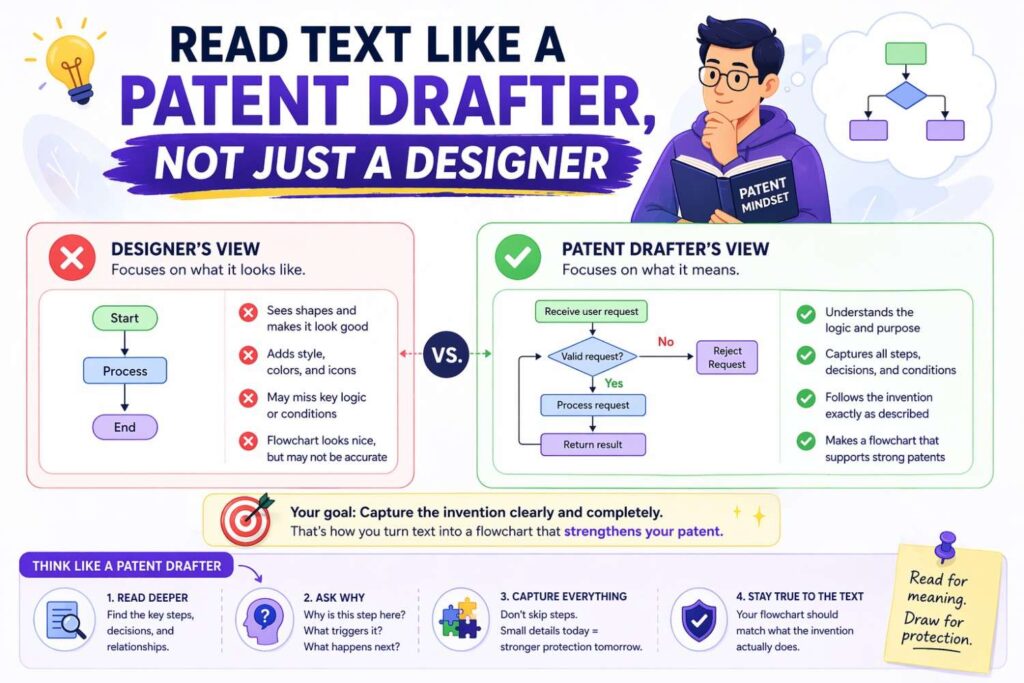
If you are generating flowcharts for patent specs, you need a different mindset than if you were making internal product diagrams.
An internal product diagram often aims to show exactly how the current system works right now.
A patent flowchart often aims to show the invention in a way that is accurate, supported, and useful for protection. That means you want clarity, but you also want room.
You do not want to lock the figure into details that are not needed.
For example, suppose your system currently uses a transformer model, a specific feature store, a named database, and a threshold value of 0.82. If those exact details are not the heart of the inventive idea, they may not belong in the core flowchart. The figure may be stronger if it says “process input data using a trained model” rather than naming one exact model family. It may be stronger to say “determine whether a score satisfies a criterion” rather than “compare to threshold 0.82.”
This does not mean you should hide substance. It means you should separate what matters from what does not.
Ask yourself these questions while reading the source text.
What steps are essential to the inventive concept?
Which steps are examples, not requirements?
Which terms are implementation-specific but not central?
Where can one broader phrase cover several narrow versions?
Where should alternate embodiments be reflected?
This is one of the hardest parts of patent drafting, and it is also where founders often lose value when they rush. They either go too broad and become vague, or too narrow and trap themselves in one version.
Good patent flowcharts sit in the useful middle. They are concrete enough to teach. They are flexible enough to protect.
The danger of copying text into boxes
One of the worst ways to generate a patent flowchart from text is to paste chunks of prose into rectangles and connect them with arrows.
It happens all the time. The result is ugly, hard to read, and usually too dense to help.
A flowchart is not meant to hold paragraphs. It is meant to hold labeled steps.
Each box should usually express one meaningful action or one decision. Not three actions bundled together. Not a whole sentence full of nested clauses. Not five sub-steps crammed into one shape.
There is no magic word count rule, but shorter is usually better. If a box takes too long to read, it is probably doing too much.
For example, a weak box might say:
“Receive data from a remote user device and normalize the data based on a predefined formatting protocol before comparing the normalized data against one or more stored records.”
That is really three steps.
A stronger version might break that into:
Receive data from a remote user device.
Normalize the data.
Compare normalized data to stored records.
Cleaner. Easier to follow. Easier to map to the written spec.
The same idea applies to decisions.
A weak decision box might say:
“Determine whether the confidence score generated based on the extracted data features exceeds a stored threshold value associated with the current transaction class.”
A cleaner version might say:
Does the confidence score satisfy a threshold criterion?
That still supports the concept. The details can live in the text.
The point is not to make the diagram shallow. The point is to make it usable.
Use verbs that show action
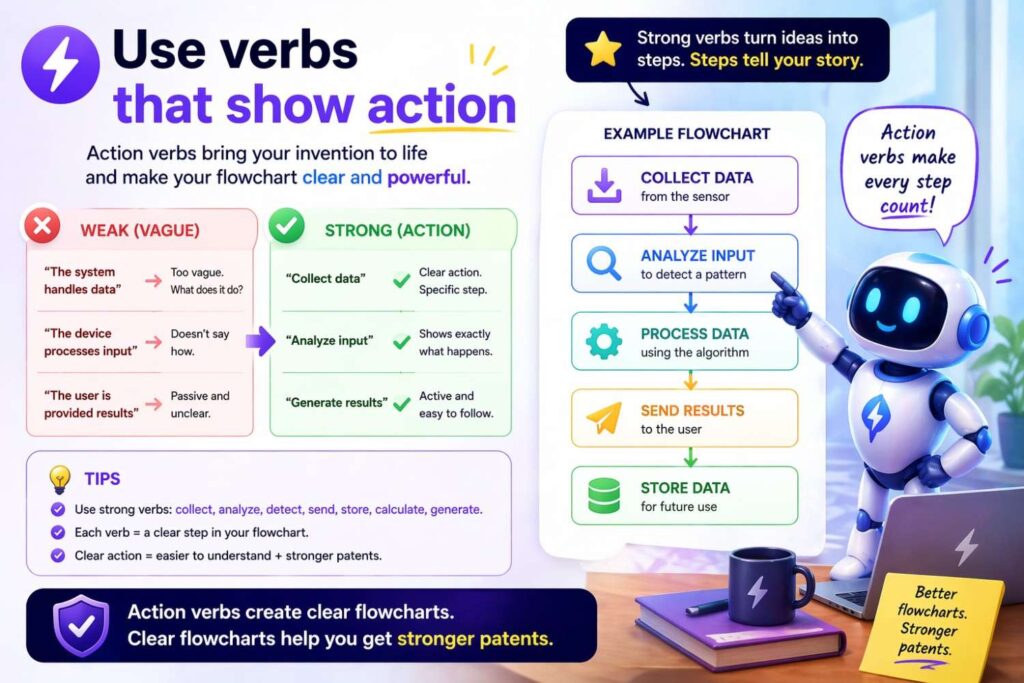
When turning text into flowchart steps, verbs do most of the work.
Good flowchart steps usually begin with a clear action word because the chart is showing a process. It is not just naming objects. It is showing motion and logic.
Strong verbs help the reader see what the system does.
Receive.
Identify.
Extract.
Determine.
Select.
Generate.
Compare.
Filter.
Rank.
Store.
Transmit.
Display.
Update.
Validate.
Authenticate.
Trigger.
Train.
Deploy.
Route.
Predict.
Approve.
Reject.
These words give movement to the chart.
Weak labels are often static nouns or vague phrases.
“Data processing.”
“User analysis.”
“Result management.”
Those do not tell the reader much. They sound official, but they do not show a step.
Instead of “user analysis,” say “analyze user activity.”
Instead of “result management,” say “store result data” or “display result to user,” depending on what is really happening.
This sounds small, but it changes the whole feel of the diagram. A good flowchart reads like a sequence of actions. It guides the eye. It carries the reader.
How to decide when one paragraph should become one figure or many
This is a judgment call, but there are reliable signs.
A single paragraph of source text can become one figure when it describes one coherent process with one main path, a limited number of decision points, and a shared goal.
A single paragraph should probably become multiple figures when it mixes different process types, different time frames, or different system roles.
For example, if the paragraph mixes model training, runtime scoring, result delivery, and user feedback loops, that is likely too much for one chart.
Split it.
One figure can show model training.
Another can show runtime scoring.
Another can show feedback-based updating.
This does not weaken the disclosure. It often strengthens it because each figure becomes clearer and easier to cite in the written description.
Another sign that you should split the figure is when the page starts to feel like a maze. If arrows cross. If boxes shrink. If branches multiply. If the chart stops feeling obvious to someone seeing it for the first time, it is probably doing too much.
A patent spec is allowed to have more than one flowchart. In many cases, it should.
A founder who wants strong protection should not chase the smallest number of figures. They should chase the clearest story.
The role of alternate embodiments
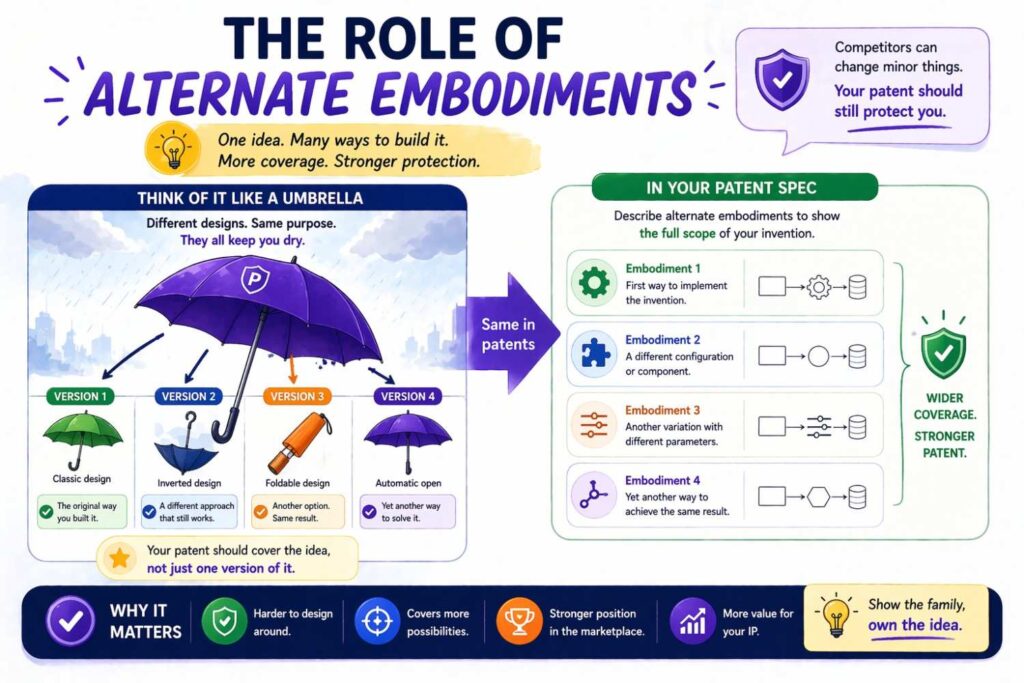
A smart patent spec often shows more than one way the invention can work.
This is powerful because real products evolve. A startup may launch version one, then pivot, improve, optimize, or swap components later. If the patent spec only shows a single narrow path, it may not age well.
Flowcharts are a great place to support alternate embodiments, but they must be handled carefully.
One option is to show the main embodiment in one figure and describe alternatives in the text. This is simple and clean.
Another option is to include branches in the flowchart. For example, after “generate classification output,” one branch may say “automatically trigger response action” and another may say “send output to human reviewer.” That shows different operating modes.
A third option is to use separate figures for different embodiments. This is often the cleanest choice when the variants are substantial.
The main thing to avoid is pretending every variation belongs in the same chart. That can make the figure bulky and confusing.
A better approach is to ask: what alternatives matter enough to support, but not so much that they ruin clarity?
Then show those alternatives in the most readable way.
How broad should your labels be
This is where patent strategy shows up inside drafting.
Suppose your invention text says the system “uses a graph neural network to generate a node relevance score for each transaction entity.” That may be true. But do you want the flowchart box to say exactly that?
Sometimes yes. Often no.
Maybe the better box is “process transaction entities using a trained model.”
Or maybe “generate a relevance score for each entity.”
Which version is right depends on what the inventive point is.
If the core novelty lies in the use of a graph neural network itself, naming it may matter.
If the real invention lies in what the system does with relational transaction patterns, then the exact model type may be less important than the scoring logic.
This is why flowchart generation from text is not just a formatting task. It is a scope task.
The label should be broad enough to cover meaningful variants but specific enough to teach the invention.
That balance is easier to hit when you are not doing everything by hand in a rush. Founders often benefit from a drafting workflow that keeps the invention story organized from the start, instead of forcing a broad-versus-narrow fight at the very end. PowerPatent helps teams build that structure early so the resulting patent work is faster, clearer, and less likely to miss valuable coverage: https://powerpatent.com/how-it-works
A useful drafting habit: write the flow before you draw the flow
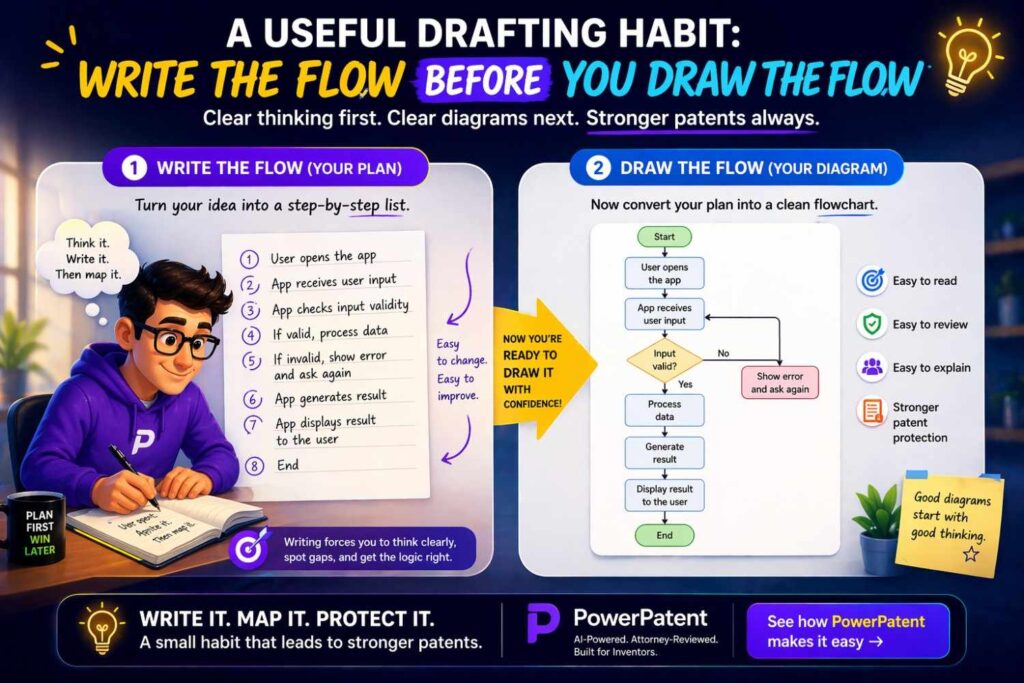
Before opening any diagram tool, write the flow as plain text.
This is one of the highest-value habits in the whole process.
Create a line-by-line sequence. One step per line. One decision per line. Show branches with indentation or simple yes and no paths.
For example:
Receive a user request.
Extract request parameters.
Determine whether the request matches a stored rule.
If yes, select a predefined action.
If no, generate a model-based action.
Transmit the selected action.
Log the result.
That simple outline gives you a draft flowchart without any design work.
It also helps you see issues early.
Maybe you realize “extract request parameters” should actually happen before a permission check. Maybe “log the result” should happen in both branches, not just one. Maybe there is a missing fallback when model confidence is low.
Fix those issues in text first. Then draw.
This saves time. More important, it creates a better figure.
The best order for building a patent flowchart from text
A clean process often looks like this.
First, gather the source text that explains the invention process.
Second, mark the trigger, the key actions, the decision points, the outputs, and the optional paths.
Third, rewrite the process as a plain sequence in short lines.
Fourth, decide whether it should be one chart or multiple charts.
Fifth, choose labels that are clear and properly scoped.
Sixth, draw the flowchart using standard shapes and readable spacing.
Seventh, compare the chart back to the written spec and fix any mismatch.
Eighth, revise the written spec if the chart reveals missing disclosure.
Ninth, review the whole package through a patent lens, not just a visual lens.
That order matters.
Most weak diagrams are made in the reverse order. Someone starts drawing before they understand the process, then tries to patch the chart afterward. That usually leads to clutter and inconsistency.
A strong figure comes from structure first, drawing second.
Common kinds of patent flowcharts in software and deep tech
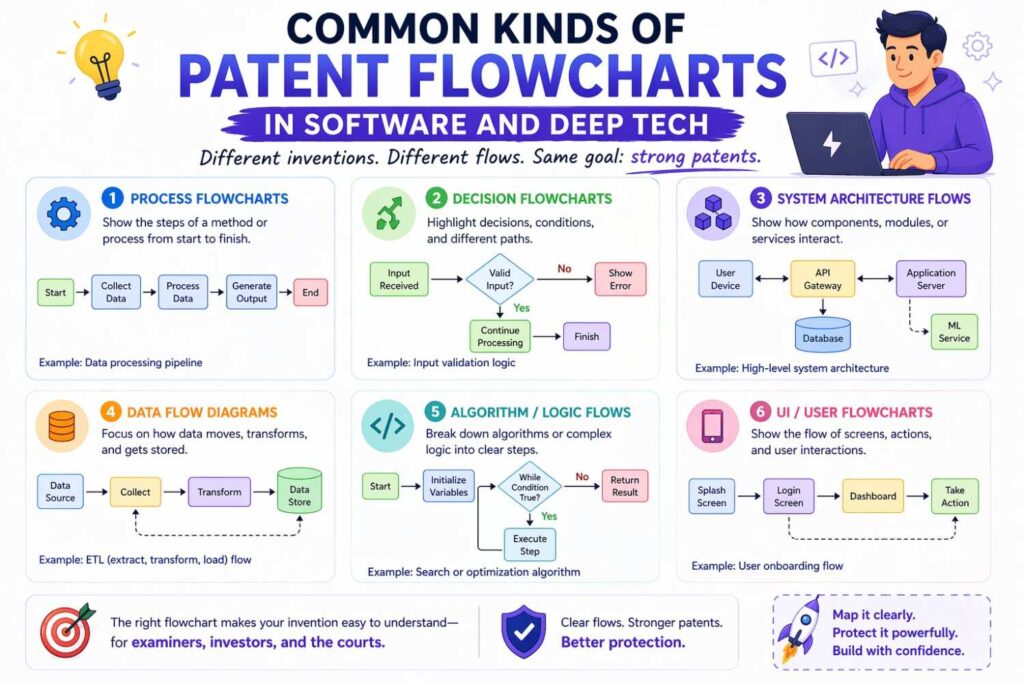
Although every invention is different, many patent flowcharts fall into a handful of useful patterns.
One common pattern is the intake-to-output method. The chart begins with receiving some input, processes that input through one or more steps, and then produces an output. This works for search systems, ranking engines, scoring tools, recommendation systems, control systems, and many AI applications.
Another common pattern is the validation route. The chart shows a set of checks. The system receives an input, tests it against rules or models, branches based on the result, and then either approves, rejects, flags, or escalates.
Another pattern is the training-and-use split. One figure shows how a model or ruleset is built. Another shows how the trained asset is used during live operation.
Another pattern is the event response path. The system detects an event, classifies it, determines a response, executes an action, and updates a record.
Another pattern is the feedback loop. The process does not end after one pass. It monitors results, adjusts a parameter, retrains, updates a profile, or changes future behavior based on observed outcomes.
Knowing these patterns helps you read source text more intelligently. You start seeing what kind of process you are really dealing with, which makes the conversion to flowchart much easier.
What standard shapes usually mean
Patent flowcharts do not need artistic flair. Standard shapes work well because they are familiar.
A rectangle is commonly used for a process step.
A diamond is commonly used for a decision.
An oval or rounded shape may be used for start or end points.
Arrows show direction.
That is enough for most patent flowcharts.
Do not overcomplicate the symbol set unless there is a real need. Fancy notation can distract from the invention.
The key is consistency. If you use a diamond for decisions, keep doing that. If you label arrows for yes and no branches, do it consistently.
Simple, clean, readable shapes are almost always better than stylish ones.
Keep the reader moving
A good patent flowchart has rhythm.
The reader should know where to look next without effort.
That means the visual path matters.
Top-to-bottom is common and easy to follow.
Left-to-right can also work, especially when comparing branches or stages.
What matters is that the direction feels natural and stable throughout the figure.
Boxes should have enough spacing to breathe.
Branch labels should be easy to find.
Arrow crossings should be avoided where possible.
Text should be centered and legible.
When a chart feels hard to follow, it is often not because the invention is complex. It is because the visual flow is poor.
This is why diagram generation should not be treated as an afterthought. Even a strong invention can look weak if the reader gets lost halfway through the figure.
How to handle loops
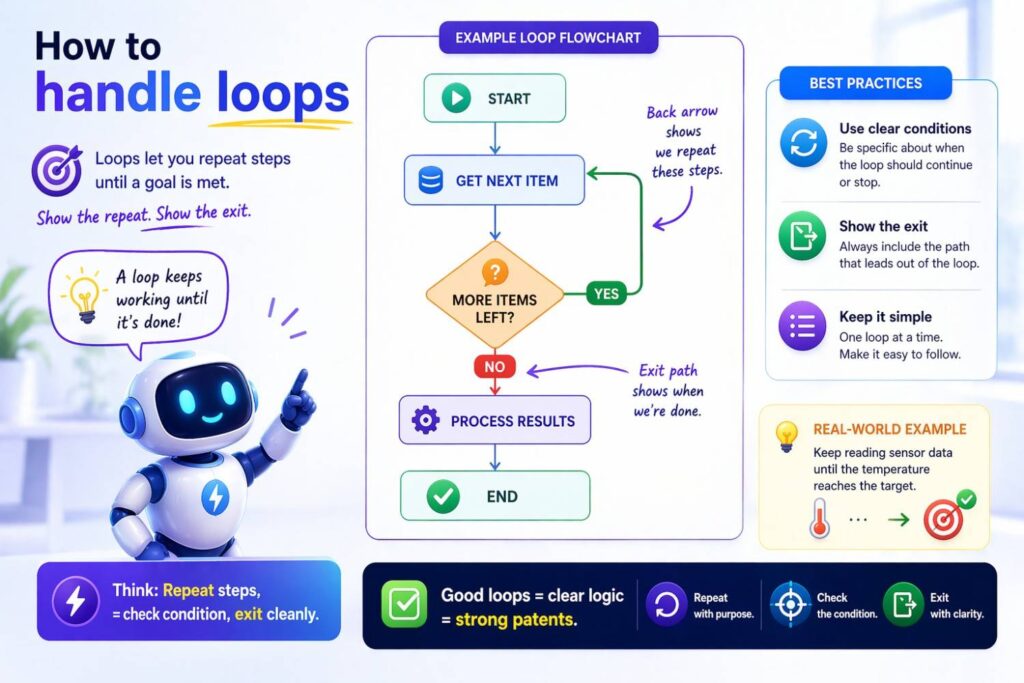
Many software and control processes loop.
A system may retry a task. It may keep sampling until a condition is met. It may update a model after each result. It may re-rank items as new data comes in.
Loops are fine in a patent flowchart, but they should be shown carefully.
The simplest way is to show the main forward path and then draw an arrow back to the repeated step. Label the condition that triggers the return if needed.
The mistake to avoid is building a bowl of spaghetti. If the loop line wraps around half the page and crosses three other branches, the figure needs redesign. Sometimes the better move is to break the looped process into a separate figure or show the repeated action as part of a higher-level step.
Another useful move is to describe the repetition in text while keeping the figure abstract enough to stay readable. For example, a box may say “iteratively update model parameters” without showing every internal cycle.
Again, clarity comes first.
How much detail belongs in a single box
There is no fixed rule, but there is a helpful test.
Ask whether the box communicates one idea or several.
“Generate a score based on extracted features” is one idea.
“Extract features, normalize values, apply a model, compare output to a threshold, and update a stored profile” is several ideas.
When a box contains multiple meaningful actions, consider breaking it apart.
At the same time, do not atomize the figure so much that it becomes a ladder of tiny boxes with no meaning. A flowchart with forty micro-steps can be just as bad as one with six overloaded boxes.
The right level of detail is the level that shows the inventive logic in a way a reader can follow.
That answer will differ by invention. Some systems need more granularity because the novelty lives in the sequence itself. Others are better served by higher-level steps because the inventive point lies in the overall approach, not each sub-action.
Turning claims into flowcharts
Sometimes teams try to build the flowchart directly from claim language.
This can work, but it has limits.
Claims are often dense and compressed. They are written to define protection, not to teach the invention in the easiest possible way. As a result, claim language may hide process order, omit optional context, or pack several actions into one long phrase.
If you start from claims, it often helps to translate them into plain process statements first.
Take each claim element and ask what actual action it represents.
Then place those actions in a logical sequence.
Then decide which parts belong in the figure and which belong in the text.
A claim may say something like:
“receiving, by a computing system, input data associated with a target event; generating, based on the input data, a feature vector; determining, using the feature vector and a trained model, a predicted action; and causing execution of the predicted action”
That can become a clean flowchart with boxes that say:
Receive input data.
Generate a feature vector.
Determine a predicted action using a trained model.
Execute the predicted action.
That is simpler without changing the substance.
Turning code comments into flowcharts
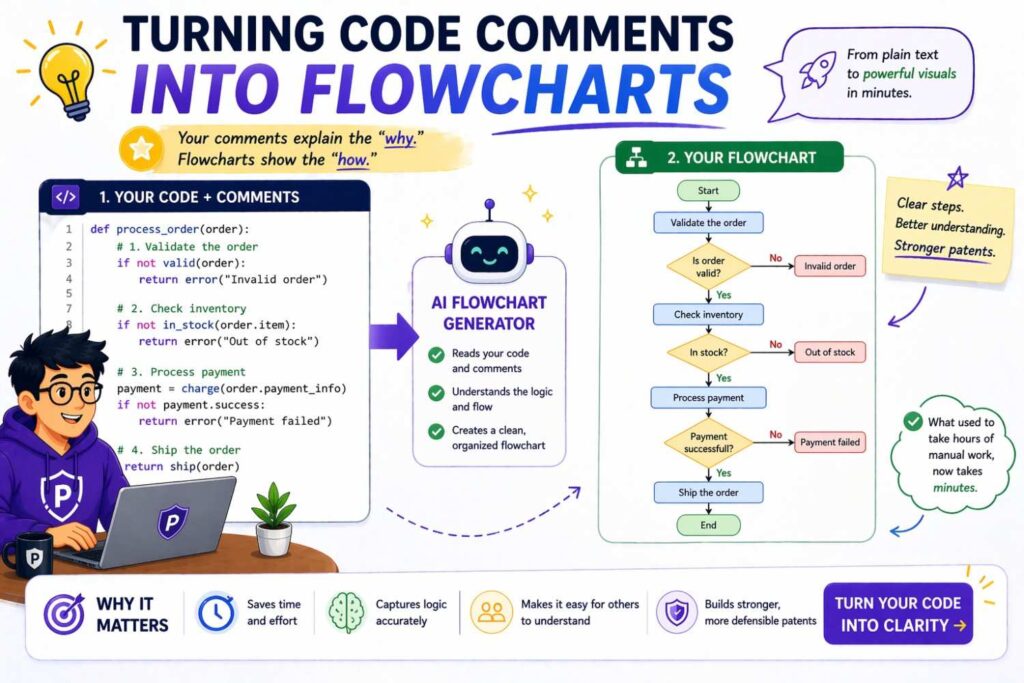
Engineers often have the best raw material for patent flowcharts sitting inside code or design notes.
The problem is that code comments often focus on implementation, not invention story.
A code comment may say:
Load embedding cache, compute semantic similarity over k nearest items, apply post-filter constraints, and update search result list.
That is useful, but it may not be the best direct flowchart text.
You may want to step back and ask what function that sequence serves in the inventive process.
Perhaps the flowchart step should be “identify candidate items based on semantic similarity” followed by “filter candidate items based on post-filter constraints” followed by “generate a result list.”
That preserves the logic while raising the level of abstraction to something more patent-friendly.
The skill here is translation, not transcription.
AI-generated flowcharts from text: helpful, but not enough by themselves
A lot of people now ask whether AI can generate patent spec flowcharts from text automatically.
The answer is yes, partly.
AI can be very helpful in turning rough explanation into a first-pass sequence. It can identify action verbs, extract steps, organize branches, and draft a clean visual outline much faster than doing everything from scratch.
That is real value.
But there is a limit.
Patent flowcharts are not just visual summaries. They are part of a legal disclosure. That means the output must be checked for support, scope, clarity, and consistency with the rest of the spec.
An AI tool may be able to produce a decent first draft from technical text, but it may not know which detail is too narrow, which missing branch matters, which label creates accidental limit, or which figure wording clashes with a broader claim strategy.
That is why the best workflow is not “AI alone” and not “manual everything.” It is smart tooling plus expert review.
That is exactly the model PowerPatent uses. Founders get the speed of modern software and AI-assisted drafting help, but the work is still backed by real patent attorneys who can catch the issues that raw automation misses: https://powerpatent.com/how-it-works
How to make flowcharts support stronger patent protection
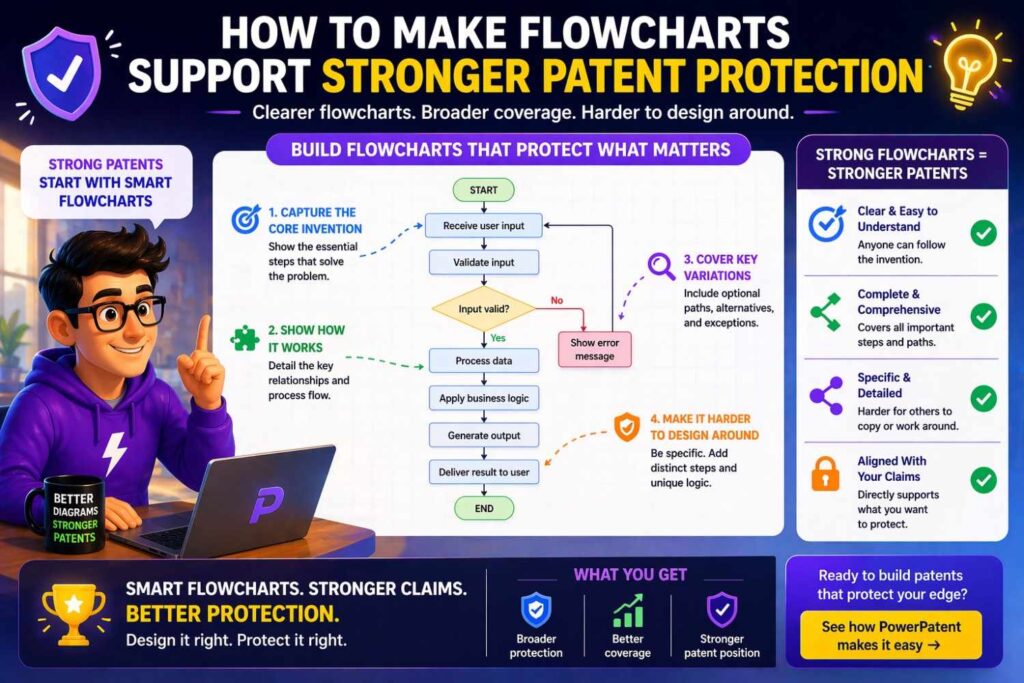
A flowchart can do more than explain. It can help support better coverage when it is drafted with care.
One way it helps is by showing meaningful order and logic. If your inventive concept lies in a sequence of operations, a good chart makes that sequence visible.
Another way it helps is by showing branching and alternatives. This can support broader disclosure because it shows that the invention is not locked to one rigid path.
Another way it helps is by linking components and outcomes. The chart can make clear how one step leads to another, which can matter when explaining technical effect or practical use.
Another way it helps is by revealing additional embodiments during drafting. Founders often discover new claimable angles once they visualize the process. A fallback path may be inventive. A feedback loop may matter. A scoring method may deserve its own treatment. A flowchart makes those opportunities easier to see.
The chart itself is not the patent. But it can make the whole patent stronger when it helps surface and support the right material.
Writing the spec text to match the flowchart
Once the flowchart is generated, the written spec should support it clearly.
That means the text should walk through the process in a way that maps to the figure. The labels in the figure do not need to be copied word for word, but the written description should explain each major step and each decision point.
The easiest way is to write a narrative that follows the figure in order.
For example, the text may say that in some embodiments a system receives input data, extracts a feature set, determines whether the feature set satisfies a criterion, and in response either triggers a first action or a second action. The text may go on to explain examples of the criterion, examples of the actions, and possible alternate paths.
That creates support and consistency.
A mismatch between figure and text can create problems. If the chart shows a verification branch that the text never describes, that is weak. If the text describes optional re-ranking and fallback logic that the chart never hints at, that may be acceptable, but you should consider whether another figure would help.
The best patent packages feel aligned. The text and figures reinforce each other.
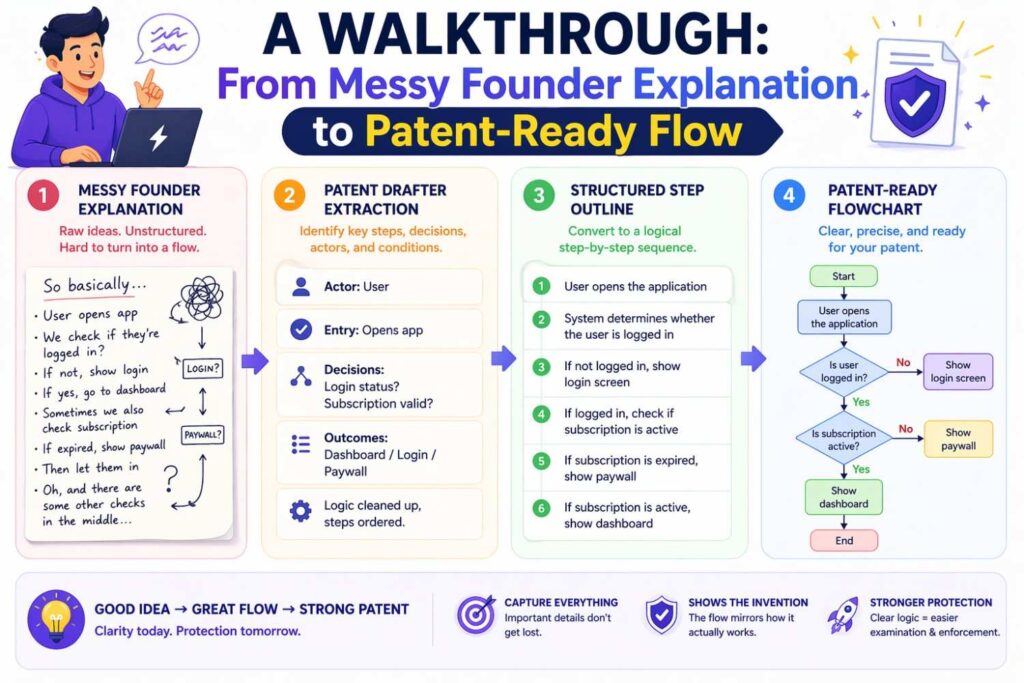
A walkthrough: from messy founder explanation to patent-ready flow
Let us take a more realistic startup-style explanation.
A founder might say something like this:
We take user voice input from the mobile app, clean the audio, convert it to text, identify intent, pull account and context data, figure out what the user is actually asking, then either answer directly or send the request to a task module. If the confidence is low we ask a follow-up question. We also log the whole thing and update a user preference profile over time.
That is a good invention explanation in founder language. It is not yet a flowchart.
Now we clean it up.
The trigger is receiving voice input from the mobile app.
The core steps appear to be cleaning audio, converting to text, identifying intent, retrieving account and context data, determining request type, and either answering directly or sending the request to a task module.
The decision is confidence level. If low, the system asks a follow-up question.
There is also logging and profile updating, which may happen after response or after each interaction.
A first-pass text flow could look like this:
Receive voice input from a mobile app.
Process audio input.
Convert audio input to text.
Identify user intent based on text.
Retrieve account data and interaction context.
Determine a request type.
Determine whether intent confidence satisfies a threshold.
If confidence is below the threshold, generate a follow-up question.
If confidence satisfies the threshold, determine whether the request is answerable directly.
If yes, generate and transmit a direct response.
If no, route the request to a task module.
Log interaction data.
Update a user preference profile.
Now we can ask patent questions.
Should “process audio input” and “convert audio input to text” be separate boxes? Probably yes, if that distinction matters.
Should “retrieve account data and interaction context” be one box or two? That depends on whether the use of context is a meaningful part of the invention.
Should “generate and transmit a direct response” be one box or two? In many cases, one is fine.
Should logging and profile update occur in both branches? If so, the chart should reflect that or the text should explain it.
Could there be a second figure for profile updating over time? Possibly.
You can see how the act of structuring the flow uncovers drafting choices. That is valuable work.
The biggest mistakes people make
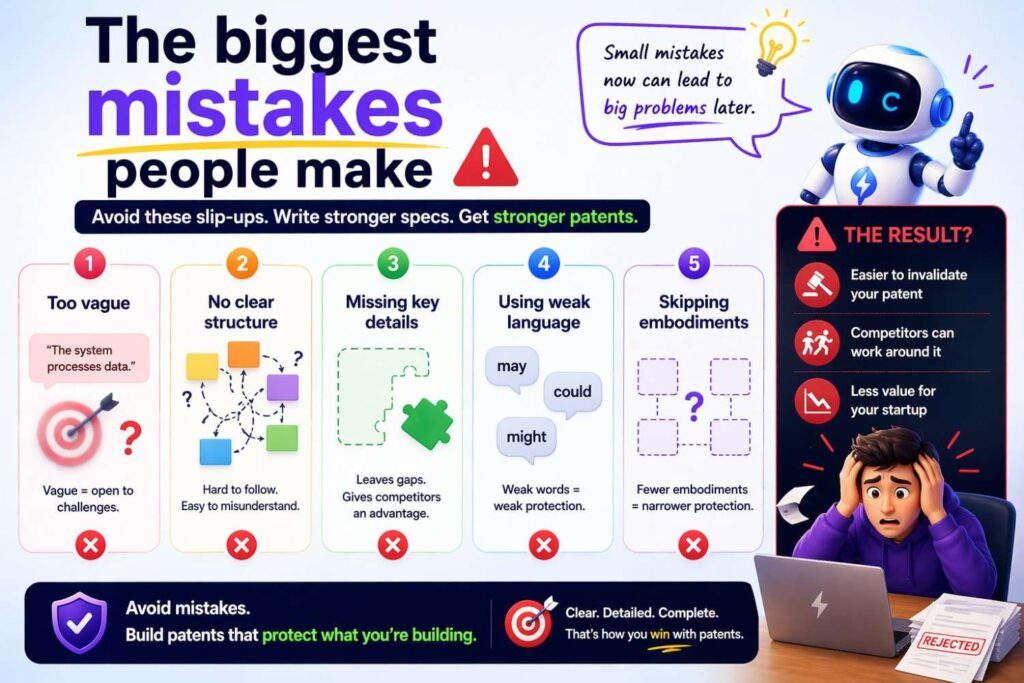
The first big mistake is overloading one figure.
The second is copying source text too literally.
The third is making labels too narrow too early.
The fourth is making labels so broad they stop teaching anything real.
The fifth is using the current product implementation as the only embodiment.
The sixth is failing to align the figure with the written spec.
The seventh is treating diagram work as a cosmetic task instead of a strategy task.
The eighth is waiting until the very end of drafting to think visually.
The ninth is forgetting that some of the most important invention value may hide in branches, fallback logic, setup flows, or post-processing steps that are easy to leave out.
The tenth is trying to do all of this from memory instead of working from actual source material and a structured drafting process.
How founders can generate better flowcharts even before talking to counsel
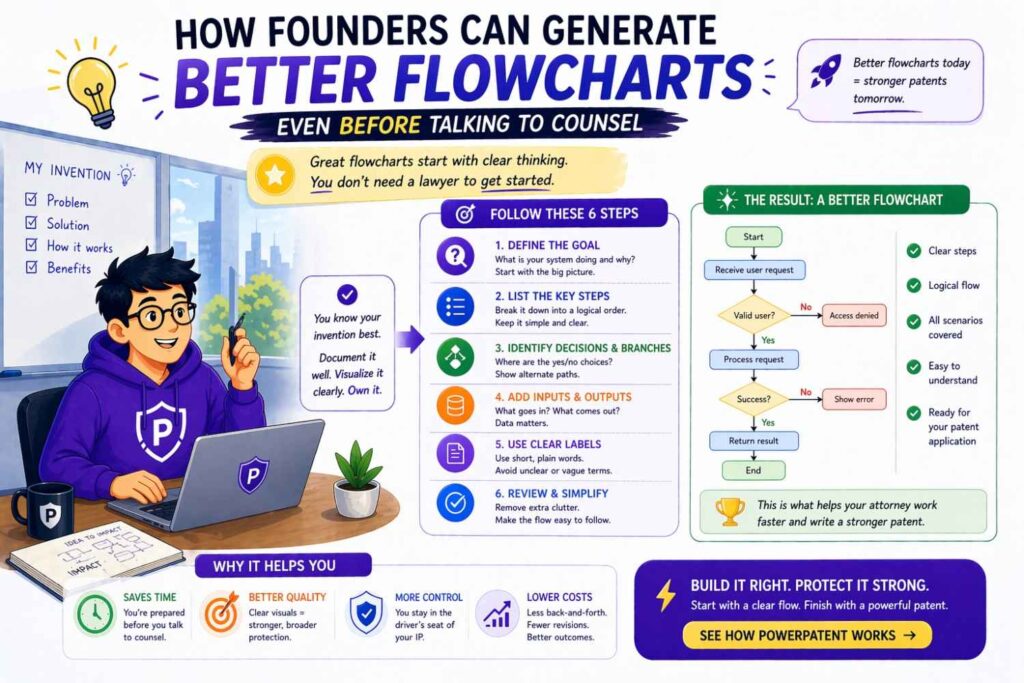
You do not need to be a patent expert to prepare useful material.
What helps most is clear invention explanation.
If you are a founder or engineer, try describing your invention in plain language with the process front and center. Walk through what happens first, next, and after that. Explain where the system makes choices. Explain what can vary. Explain what happens when things go wrong. Explain what result gets produced.
Do not worry about sounding formal. Accuracy matters more than style at this stage.
A spoken walkthrough can be especially helpful. Many inventors explain systems more clearly with their voice than with polished writing. Once that explanation is captured, it can be structured into a flow.
You can also separate your explanation into modes. For example, setup mode, runtime mode, admin mode, and learning mode. That alone can make later figure generation much easier.
The cleaner your source explanation, the stronger the resulting patent work.
And when you use a workflow built for founders, you do not have to carry the whole burden yourself. PowerPatent helps technical teams capture the invention clearly, organize it into filing-ready structure, and get attorney-backed patent work without the usual drag of old-school firm process: https://powerpatent.com/how-it-works
Why “good enough” figures can still cost you
Many startup teams think the diagram only needs to be passable. As long as there is a picture, they assume it is fine.
That can be expensive thinking.
A weak flowchart can hide invention value instead of highlighting it. It can make the spec look thinner than it is. It can leave out alternate paths that matter. It can cause the written disclosure to stay vague. It can narrow the invention story around one current version. It can miss the process step that later turns out to be the key differentiator.
That does not mean every chart must be perfect. It means the chart should be treated as part of the substance.
This is one reason fast-moving startups benefit from a system that keeps invention capture and patent drafting organized from the start. It is not just about saving time. It is about preserving value while you move quickly.
A deeper point: flowcharts force invention discipline
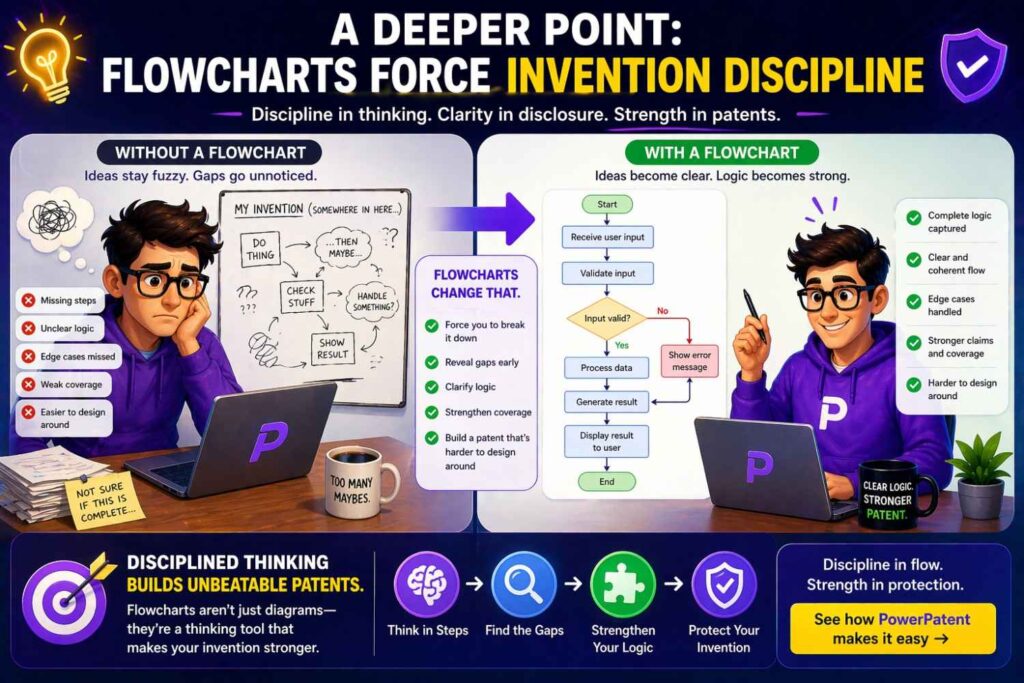
There is a hidden benefit to generating patent flowcharts from text.
They force discipline.
When you draw the invention as a process, it becomes much harder to bluff your way through fuzzy thinking. You notice where the logic jumps. You notice where terms are undefined. You notice where the system seems magical because no one wrote down the middle steps.
That is healthy.
A patent filing should not rely on hand-waving. It should teach enough of the invention to support real protection. Flowcharts are excellent at exposing weak spots in that teaching.
This is especially true for AI and software inventions. Teams often talk at a high level about what the model does, but not how the overall system receives inputs, processes data, applies criteria, selects outputs, and handles exceptions. A flowchart pushes those details into the open.
That discipline improves more than the figure. It improves the whole filing.
The relationship between flowcharts and drawings rules
Patent drawings have formatting expectations, and formal filing rules will matter in the final submission. But at the concept stage, the deeper issue is not whether the box corners are perfect. It is whether the figure tells the invention story clearly enough.
You can clean formatting later.
Do not let drawing rules become an excuse to delay the real thinking work. The hard part is structure and scope. Once those are right, formatting is manageable.
Of course, final drawings should still be prepared carefully. Clean labels, consistent numbering, readable lines, and proper integration with the spec all matter. But founders often overfocus on polish and underfocus on content.
The chart needs to be right before it needs to be pretty.
How to name the figure in the spec
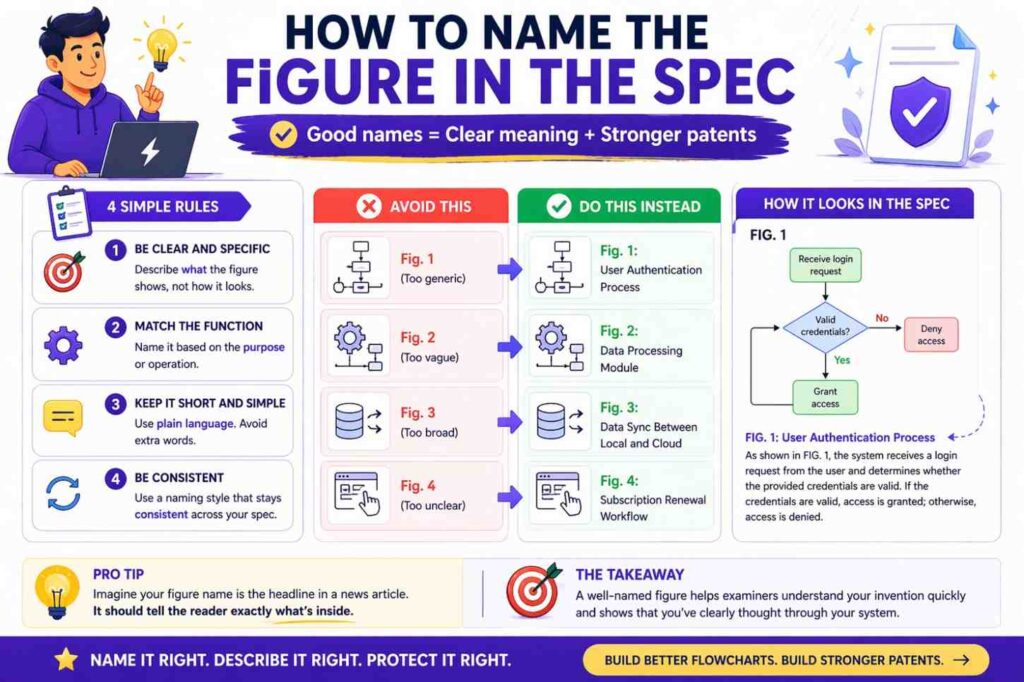
When you add the flowchart to the patent spec, the figure title should be plain and functional.
“FIG. 3 is a flowchart illustrating an example method for generating a ranked recommendation output.”
That style works because it tells the reader what the figure is about without overloading the caption.
The detailed explanation belongs in the body of the description.
Within that description, refer to the steps in a natural way. Walk the reader through the process shown in the figure and connect it to the invention.
How many flowcharts is too many
There is no magic number.
Too few, and you may force too much into one figure or leave important process stories buried in text.
Too many, and the spec can become repetitive or fragmented.
The better question is whether each figure earns its place.
A figure earns its place if it makes a distinct part of the invention easier to understand, better supported, or more clearly disclosed.
If two figures tell basically the same story, one may be enough.
If one figure is carrying three different stories badly, split it.
Use the number of figures the invention needs, not the number that feels neat.
What founders should capture today if they want good patent flowcharts later
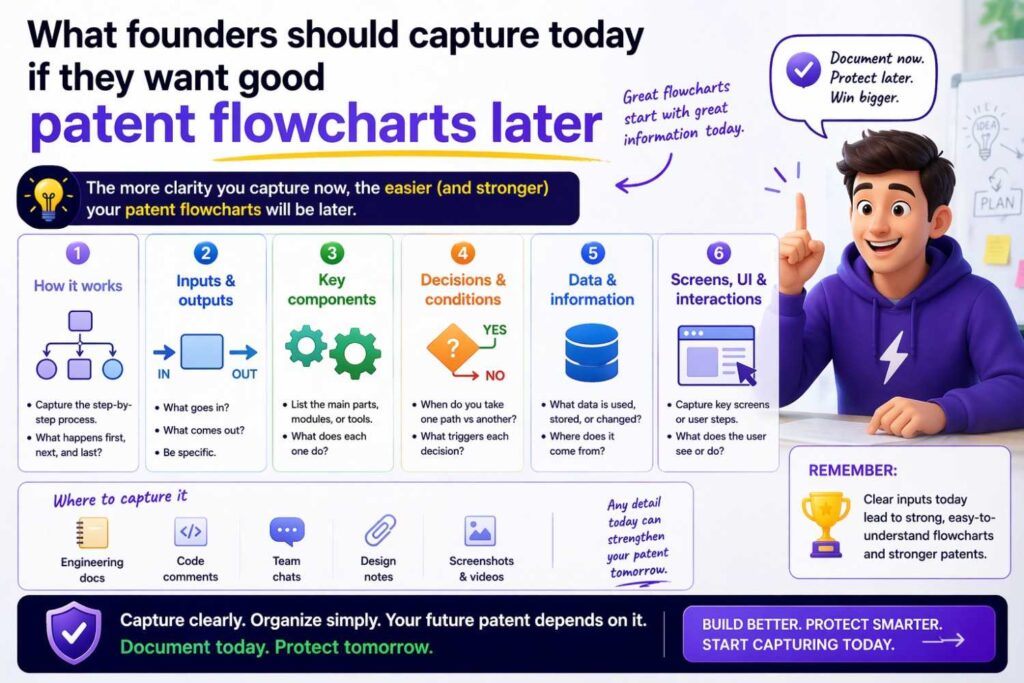
Capture process explanations while the invention is fresh.
Capture the normal path.
Capture what happens when confidence is low, data is missing, a request fails, or the system chooses a fallback.
Capture what setup or training happens before runtime.
Capture what feedback changes later behavior.
Capture what the current implementation does, but also where other versions could work.
Capture why the process is better than old approaches.
These notes become gold during drafting.
The best patent work often comes from founders who document how the system actually thinks and acts, not just what marketing says it does.
Turning product language into patent language without losing the meaning
Founders often explain systems in product terms.
“The app helps users find the best next action.”
That is fine for marketing, but weak for drafting a flowchart.
The patent version asks: how does the system do that?
Does it receive user context data? Score a set of possible actions? Apply one or more rule filters? Rank candidates? Select a top action? Display it? Monitor whether the user follows it? Update a profile?
Those steps are where the patent value usually lives.
Generating a flowchart from text means converting outcome-focused language into process-focused language.
This does not mean using legal jargon. It means showing the mechanism.
A good patent flowchart says what the system does, in order, with enough specificity to teach and enough flexibility to protect.
A practical editing test for every flowchart box
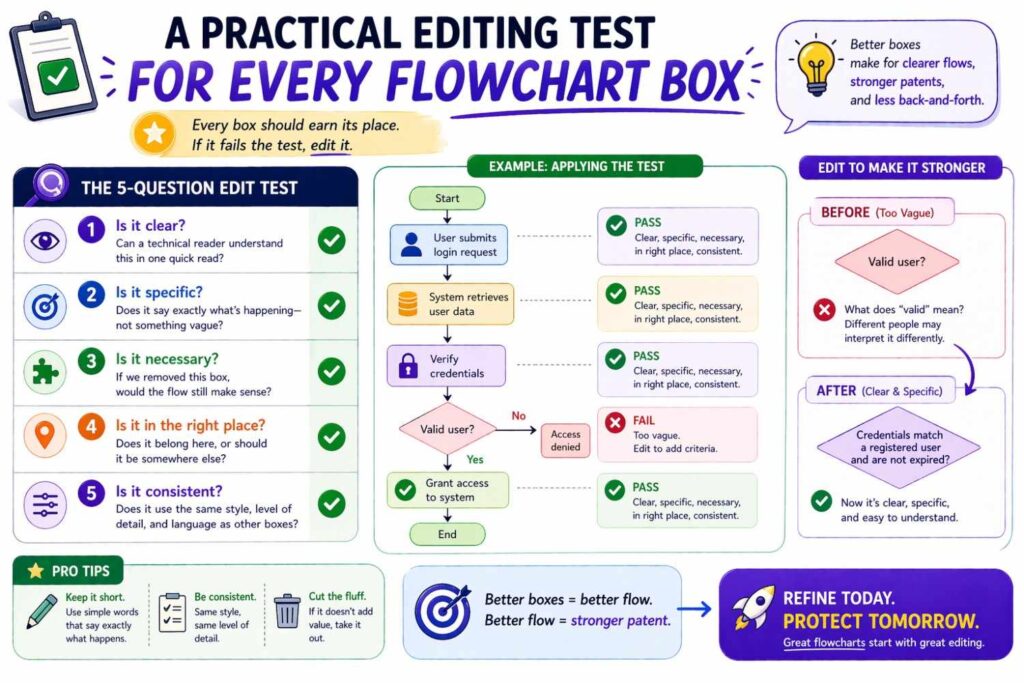
For every box in the chart, ask four simple questions.
What is the action here?
Why is it here?
Could this label be clearer?
Could this label be broader without losing the invention?
If you cannot answer why the box is there, remove it or rethink it.
If the action is unclear, rewrite it.
If the label is just an implementation detail that does not matter, generalize it.
If the label is so broad it could apply to anything, sharpen it.
This editing pass is where many charts improve the most.
Human review still matters
Even with good source text, good tooling, and a clean process, human review matters.
Someone needs to ask whether the flowchart supports the filing strategy. Someone needs to catch where a branch is missing, where a label narrows scope, where a figure implies an order that should be optional, where a training flow should be separated from runtime, or where a helpful alternative embodiment is hiding in the notes.
That kind of judgment is exactly why attorney-backed workflows matter.
Founders do not just need speed. They need confidence that the speed is not creating blind spots.
PowerPatent is built around that idea. It gives startups a faster path to patent work, but it does not leave them alone with a black-box tool. Real patent attorneys review and guide the work so founders can protect what they are building with more confidence and less friction: https://powerpatent.com/how-it-works
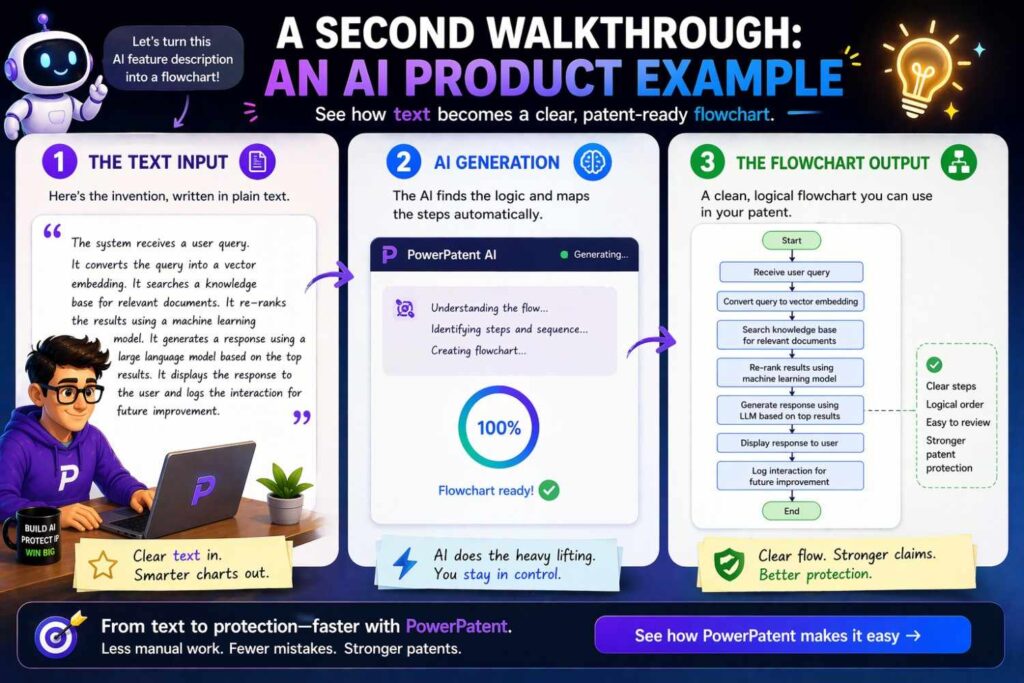
A second walkthrough: an AI product example
Let us take an AI product example because this is where many teams feel the most confusion.
Suppose the source text says this:
A system receives a document from a user, divides the document into segments, encodes each segment into embeddings, compares the embeddings against a stored set of knowledge vectors, retrieves relevant context items, generates a response using a language model based on the document and the context items, determines a confidence score for the response, and either returns the response or requests clarification from the user. The system may store interaction results for later tuning.
There is a lot going on there, but it can still become a clean patent flow.
One possible chart:
Receive a document from a user.
Divide the document into segments.
Generate embeddings for the segments.
Compare the embeddings to stored knowledge vectors.
Retrieve relevant context items.
Generate a response based on the document and the context items.
Determine a confidence score for the response.
Does the confidence score satisfy a criterion?
If yes, return the response.
If no, request clarification from the user.
Store interaction results for later tuning.
Now ask the scope questions.
Should the chart say “language model”? Maybe, maybe not. If the inventive point is retrieval-augmented generation broadly, perhaps “generate a response using a response model” is enough. If the invention is really about the use of a language model in a specific interaction flow, naming it may help.
Should “store interaction results for later tuning” happen after both branches? Probably yes.
Should the tuning process have its own figure? If later tuning is important, very possibly.
Again, the flowchart generation process is also a thinking process.
What to do when the source text is bad
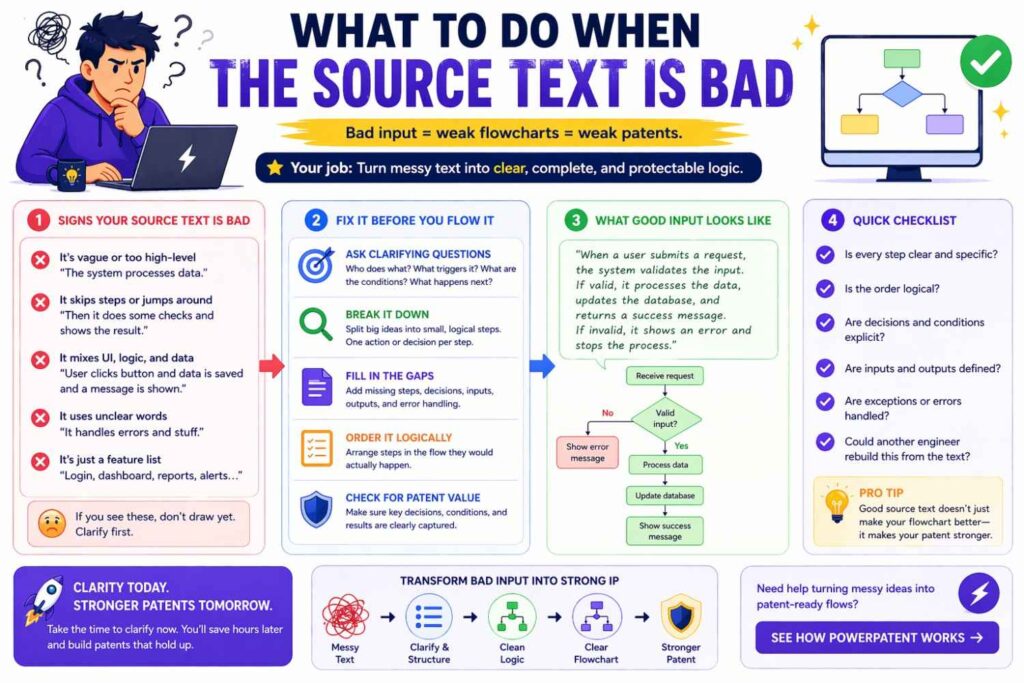
Sometimes the source text is thin, vague, or incomplete.
Do not force a polished diagram from weak material. Instead, use the diagramming process to expose what is missing.
Ask, at least internally:
What starts the process?
What data comes in?
What transformation happens next?
How does the system decide among options?
What result comes out?
What happens if the ideal path fails?
What changes over time?
Where does the invention seem different from the old way?
When you cannot answer those questions from the text, the source material needs work.
That is not failure. That is useful discovery.
A weak source draft is better than a weak filed patent. If the flowchart exercise shows that the invention explanation is incomplete, fix it before filing.
The old way versus the smarter way

The old way of handling patent figures often looks like this. A founder sends scattered notes. A firm spends time translating them slowly. Weeks pass. Drafts come back that feel generic or disconnected from the real product.
The founder tries to patch in missing details late. The figure work is rushed. The result may be technically acceptable, but not as strong or founder-friendly as it should be.
The smarter way is structured from the beginning. The invention is captured clearly. The process logic is organized early. Flowcharts are generated from real technical explanation, not guessed from vague summaries. The written spec and visuals develop together. Attorney review catches scope and support issues before filing.
That difference matters.
It saves time, yes. But more than that, it gives founders more control over the quality of what gets filed in their name.
That is why more startup teams are moving toward modern patent workflows like PowerPatent, where software makes the process cleaner and faster while real attorneys help make sure the output is strong: https://powerpatent.com/how-it-works
How to keep the article’s main lesson simple
At the heart of all this, generating patent spec flowcharts from text comes down to one idea.
Do not start with drawing.
Start with structure.
Find the process hidden inside the text. Pull out the steps. Pull out the decisions. Pull out the outputs. Rewrite the flow in short action lines. Decide what belongs together. Decide what deserves its own figure. Then draw a chart that teaches the invention clearly and supports the broader patent story.
That is the path.
Not flashy software.
Not copy-paste boxes.
Not giant paragraphs inside shapes.
Structure first. Figure second.
When you work that way, flowcharts stop feeling like a painful extra task. They become one of the fastest ways to understand whether your patent draft is actually strong.
A final founder-focused example
Imagine two startup teams building similar products.
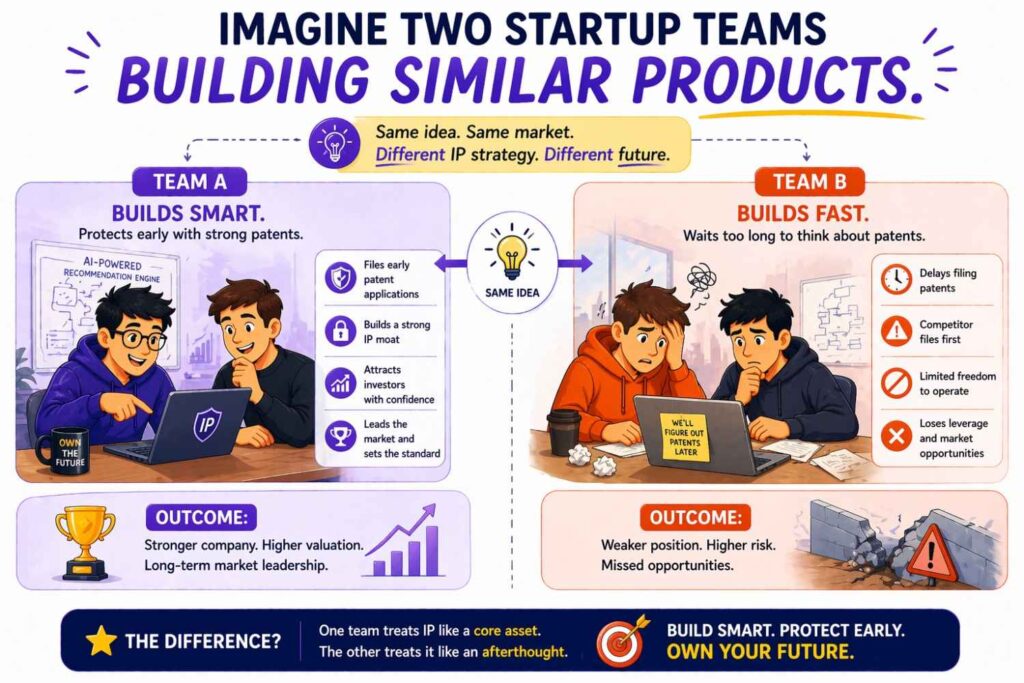
The first team writes a patent spec with broad, vague text and a generic flowchart that says “receive data,” “process data,” and “output result.” It technically has a figure. But it does not really show the invention.
The second team captures the real process. Their figure shows how input is transformed, how the system scores or classifies, what criteria drive branching, how fallback works, and how outputs are generated. Their text supports those steps. Their filing reflects the actual technical value they built.
Which team is more likely to get a filing that helps them later?
The answer is obvious.
The flowchart did not create the invention. But it helped reveal and communicate it in a much stronger way.
That is the point.
Let us make this more real.
Picture two startup teams in the same market. Both are building strong products. Both have sharp technical talent. Both know their product has real value. Both decide to file a patent.
On the surface, they look similar.
But the way they explain their invention is very different.
That difference can shape what happens next.
The startup that files too loosely
The first team moves fast, but not in a good way.
They know they should file something, so they pull together a rough description at the last minute. Their patent write-up talks about the product in broad terms. It explains the goal. It explains the user benefit. It hints at some technical steps. But it never really walks through how the system works in a clear, useful way.
Their flowchart is thin.
It has a few generic boxes like “receive input,” “process data,” and “generate output.” It looks complete at first glance. But it does not really show the logic that makes the system valuable. It does not show how decisions are made. It does not show what happens when the ideal path fails. It does not show where the product is actually smarter than older tools.
That becomes a business problem, not just a drafting problem.
Why?
Because the patent filing now reflects a blurry version of the company’s technical edge.
If the startup later tries to show investors that it has protectable IP, the filing may not tell a strong story. If the team later wants broader claims around different versions of the product, the original spec may not give enough support. If a competitor enters the space with a similar flow but a slightly different implementation, the first team may realize too late that their own filing never captured the real architecture choices that mattered.
This is what many founders miss.
Weak invention explanation does not only hurt the patent. It can weaken the company’s position later in fundraising, partnerships, acquisition talks, and competitive strategy.
The startup that captures the real advantage
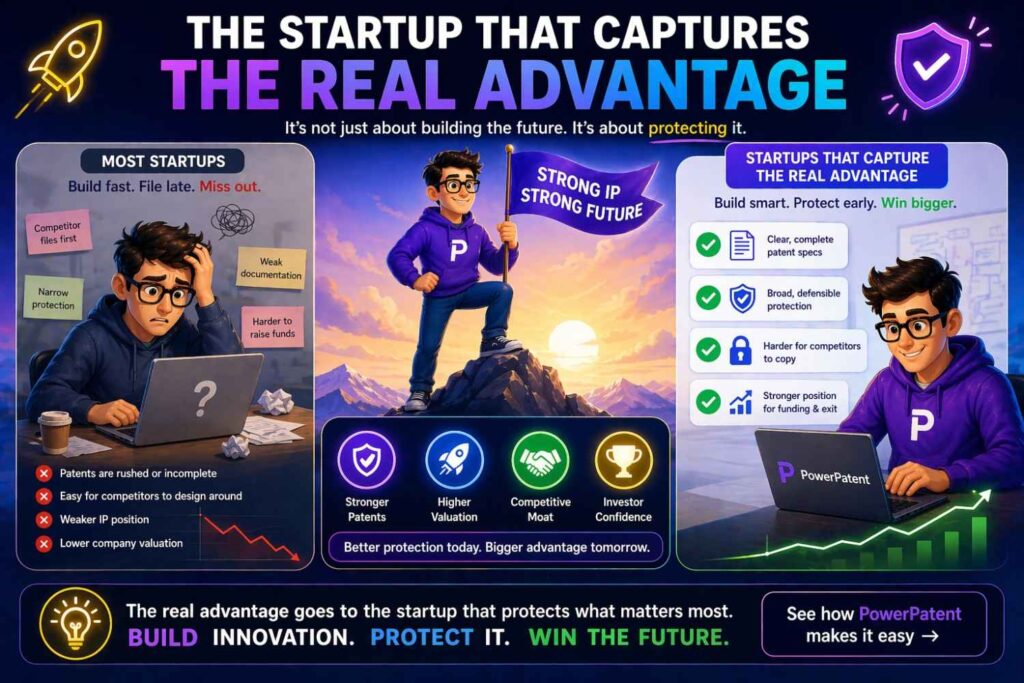
Now look at the second team.
They also move quickly. But before filing, they take the time to extract the actual process behind the product.
They do not just describe the outcome. They describe the engine.
Their write-up makes clear what starts the process, what the system receives, how it transforms that input, where it checks conditions, how it branches, what fallback paths exist, and what result gets produced. Their flowcharts show the real logic behind the product in a way that is easy to follow.
This does something important.
It turns the patent filing into a business asset that reflects the company’s real technical position.
Now the filing can support more than one conversation.
It can support legal protection.
It can support an investor story.
It can support internal alignment about what the company actually invented.
It can support future filings because the first filing was built on substance, not vague claims about being “AI-powered” or “smart.”
That is the deeper value.
A strong patent spec is not just defensive paperwork. It is a record of what makes your business special at a technical level.
Where founders should look for the true invention story
Many founders think the invention story lives in the final product demo.
Often, it does not.
The real value usually hides one level deeper.
It may live in the decision layer that chooses one action over another.
It may live in the fallback system that handles low-confidence cases better than others do.
It may live in the way your system uses context, timing, priority, risk, personalization, or past behavior.
It may live in the way your product reduces error, cuts delay, improves trust, or avoids waste.
This matters because a lot of businesses describe their product at the feature level when the stronger patent story lives at the process level.
A founder might say, “our product recommends the next best step.”
That is not yet the real invention story.
The stronger question is this: how do you produce that recommendation in a way others do not?
Do you filter inputs in a special order?
Do you weigh live signals differently from stored profile data?
Do you apply a threshold before routing to automation?
Do you use a human review path only under certain conditions?
Do you update future outputs based on prior response success?
Those are the kinds of details that can make the patent filing much more useful.
A simple business test: can a competitor rebuild your edge from your summary?
Here is a practical test founders should use.
Take your current invention summary and ask this: if a smart competitor read this, would they understand what actually makes our system different?
If the answer is no, there are two possible problems.
One, the write-up is too vague to support strong protection.
Two, your team may not yet be describing the product in a way that captures its real edge.
That is why flowchart thinking is so useful for business leaders.
It forces clarity.
A strong flowchart does not just show steps. It helps answer a strategic question: where exactly does our advantage begin?
That is not just patent value. That is company value.
The most valuable part may be the branch, not the main path
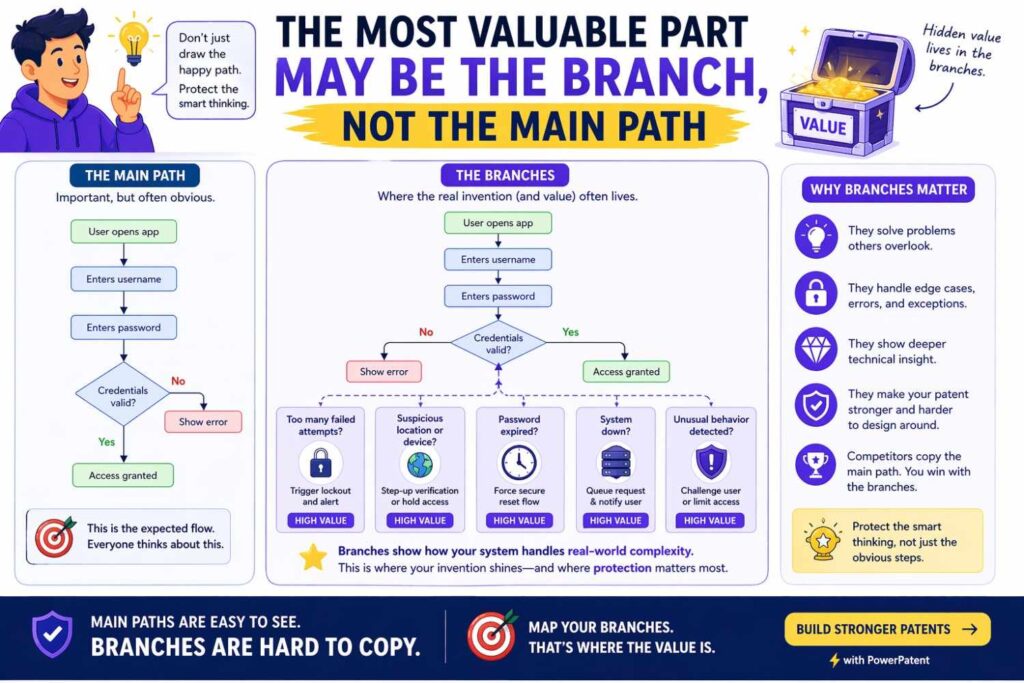
This is one of the most underused ideas in patent strategy for startups.
Many teams focus only on the happy path.
They describe what happens when everything goes right.
But in real markets, the branch logic is often where the business value lives.
Think about it.
What does your system do when data is weak?
What happens when confidence drops?
What happens when a user behaves in a way the model did not expect?
What happens when a requested action carries risk?
What happens when the system detects ambiguity?
A lot of strong products win because they handle these moments better than competitors do.
That means your patent story may be much stronger when it includes those decision points and alternate routes.
For businesses, this is highly strategic.
Competitors can often copy the surface-level feature. It is much harder to copy the hidden operational logic that makes the feature reliable, trusted, or scalable.
That hidden logic deserves attention in the spec.
Patents should match how the business plans to grow
Another mistake founders make is drafting around the current product only.
That can be shortsighted.
The better move is to map the invention against the company’s next likely growth paths.
For example, ask these questions.
Will this workflow later support more customer segments?
Will the same core engine later power more than one feature?
Will the system later move from rule-based handling to model-based handling?
Will manual review later become automated?
Will one input type later expand to many?
Will the product later support different deployment modes, such as cloud, edge, on-device, or hybrid?
These are business questions, but they should influence how the invention is described.
If your patent spec only reflects the smallest current version of the product, your filing may age badly as the company expands.
A founder should want a patent story that protects not just version one, but the shape of where the business is going.
Build a “future map” before you finalize the flowchart
Here is a highly actionable move.
Before the patent flowchart is finalized, create a simple internal future map.
This does not need to be a giant document. It can be a short working sheet used by the founder, product lead, and technical lead.
Write down three things.
First, what the system does now.
Second, what the system will likely do in the next twelve to twenty-four months.
Third, what parts may change while the core invention still stays the same.
This exercise helps you separate the heart of the invention from temporary implementation choices.
That is valuable because many teams accidentally draft around details that are likely to change soon. A future map helps you avoid that trap.
It also helps you spot alternate embodiments naturally, without forcing them.
From a business angle, this means your patent filing is more likely to support product expansion instead of lagging behind it.
Turn customer pain into flowchart depth
Founders often say they want patents around the product. A better framing is this: build patent support around the problem your product solves unusually well.
That difference matters.
A product feature may change.
A customer pain point often stays longer.
So when you generate flowcharts from text, look at the real pain the business solves and ask where your process addresses it.
If customers hate slow response times, the patent story may need to show the faster routing logic.
If customers hate false positives, the filing may need to show the validation branch, fallback review, or confidence handling.
If customers need trust and explainability, the invention story may need to show the audit trail, rule overlay, or human confirmation path.
This creates more useful business alignment.
Now the patent is not just tied to a product label. It is tied to the operating logic that solves a market pain.
That tends to create stronger long-term value.
Use flowcharts to decide what deserves its own filing later
There is also a portfolio strategy lesson here.
When founders build strong process flowcharts, they often notice that one invention is really several invention layers.
The main workflow may be one filing.
The personalization engine may deserve another.
The fallback logic may deserve another.
The training loop may deserve another.
The security or verification layer may deserve another.
This is important for businesses because not all patents should be forced into one application.
A clear flowchart can help you see where future filings may come from.
That gives the company more control over portfolio growth.
Instead of treating patent work as one event, the business can begin treating it as a sequence of smart protection moves tied to product milestones.
That is a much more strategic way to think.
A practical founder exercise to run with your team
Here is a simple exercise that can be very powerful.
Get your founder, your technical lead, and your product lead in the same room.
Take one core feature that matters to the business.
Now answer these questions in plain language.
What triggers the system?
What does the system look at first?
What choice does it make next?
What causes it to take path A instead of path B?
What happens when the normal path breaks?
What result matters most to the customer?
What makes this flow better than the old way?
Do not worry about patent wording yet.
Just get honest answers.
Then compare the answers.
You will often find that each team member describes the same feature differently. That gap is useful. It shows where the invention story is still fuzzy inside the company.
Once the team aligns on the true flow, patent drafting becomes stronger and faster.
This is also good business discipline. Teams that can explain their technical edge clearly usually make better strategic decisions far beyond IP.
The strongest filings often come from operational honesty
There is a temptation in startup patent work to make everything sound grand, seamless, and perfect.
That is not always the best path.
Some of the strongest invention stories come from operational honesty.
Maybe the system works well because it knows when not to automate.
Maybe it wins because it routes uncertain cases differently.
Maybe it saves cost because it only uses a heavy model in a narrow set of cases.
Maybe it improves trust because it stores and reuses explanation data.
These details can feel less flashy than broad claims about intelligence or automation. But they may be much more valuable.
Why?
Because they reflect the real operating choices that make the business work.
And those are often harder for competitors to replicate.
What smart businesses do before they file
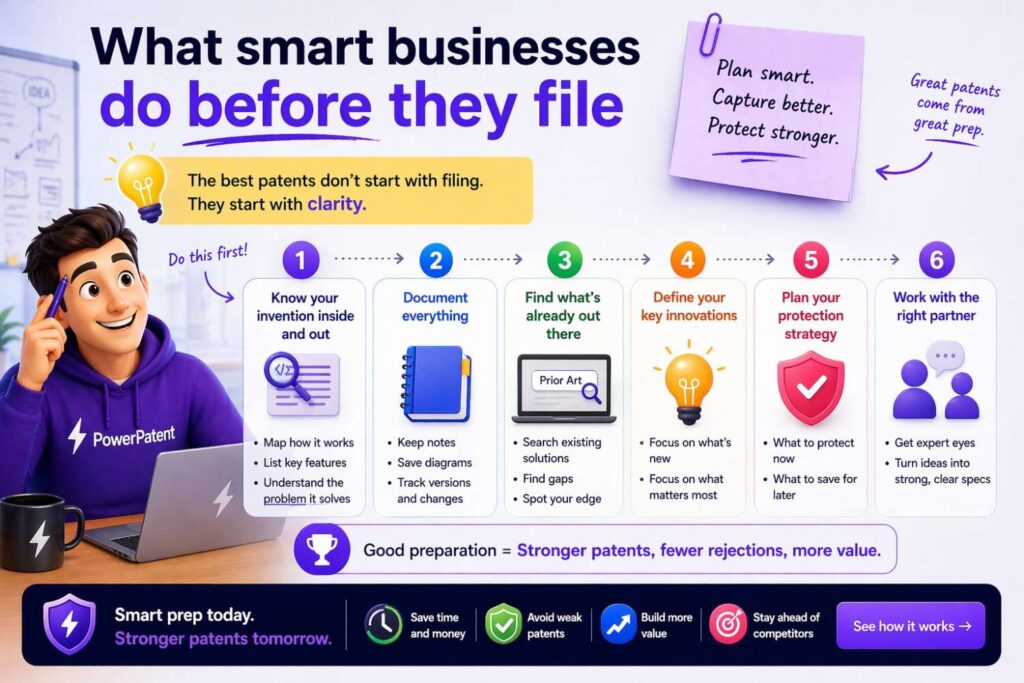
The smartest businesses do not wait until the filing draft arrives to think strategically.
They prepare the invention story first.
They identify the business-critical workflows.
They separate core logic from temporary implementation details.
They map likely product expansion.
They capture the decisions, exceptions, and alternate paths that create real advantage.
Then they build flowcharts and specs around that substance.
That approach is more strategic because it connects IP work to company direction.
It makes the patent effort feel like part of business building, not a side task.
The takeaway for founders
A final founder-focused example is really about one truth.
The companies that get more value from patents are usually not the ones with the fanciest language. They are the ones that understand their own technical edge clearly enough to describe it as a real process.
That process is what your flowchart should capture.
Not the buzzwords.
Not the headline claim.
Not the shiny outcome alone.
The real flow.
When you can show how your system makes decisions, handles edge cases, produces results, and adapts over time, you are no longer filing around surface features. You are protecting the machine behind the business.
And that is where patent value becomes far more strategic.
Conclusion
Patent spec flowcharts matter because they turn process into something a reader can follow. They help explain software, AI, systems, methods, decision logic, and technical workflows in a way plain text often cannot do on its own.
The best way to generate them from text is not to copy and paste prose into boxes. It is to extract structure from the text first. Find the trigger. Find the core actions. Find the decisions. Find the outputs. Find the alternate paths. Write the process in short lines. Then build the figure around the invention story you actually want to tell.
When done well, a flowchart does more than look clean. It helps support stronger drafting, clearer disclosure, better thinking, and more useful patent protection.
If you are building something valuable and want a faster, smarter way to turn your technical work into a strong patent filing, PowerPatent is built for that. It helps founders and engineers move from invention details to attorney-backed patent work without the usual delays and confusion. You can see how it works here: https://powerpatent.com/how-it-works
And if your current patent process still feels slow, messy, or unclear, that is a sign to upgrade the workflow before you file the next thing. The way you capture and explain your invention shapes the strength of what gets protected. A better system now can save a lot of pain later.
PowerPatent gives startups that better system: smart software, real attorney oversight, faster drafting, and more confidence that what you built is being protected the right way. Learn more here: https://powerpatent.com/how-it-works