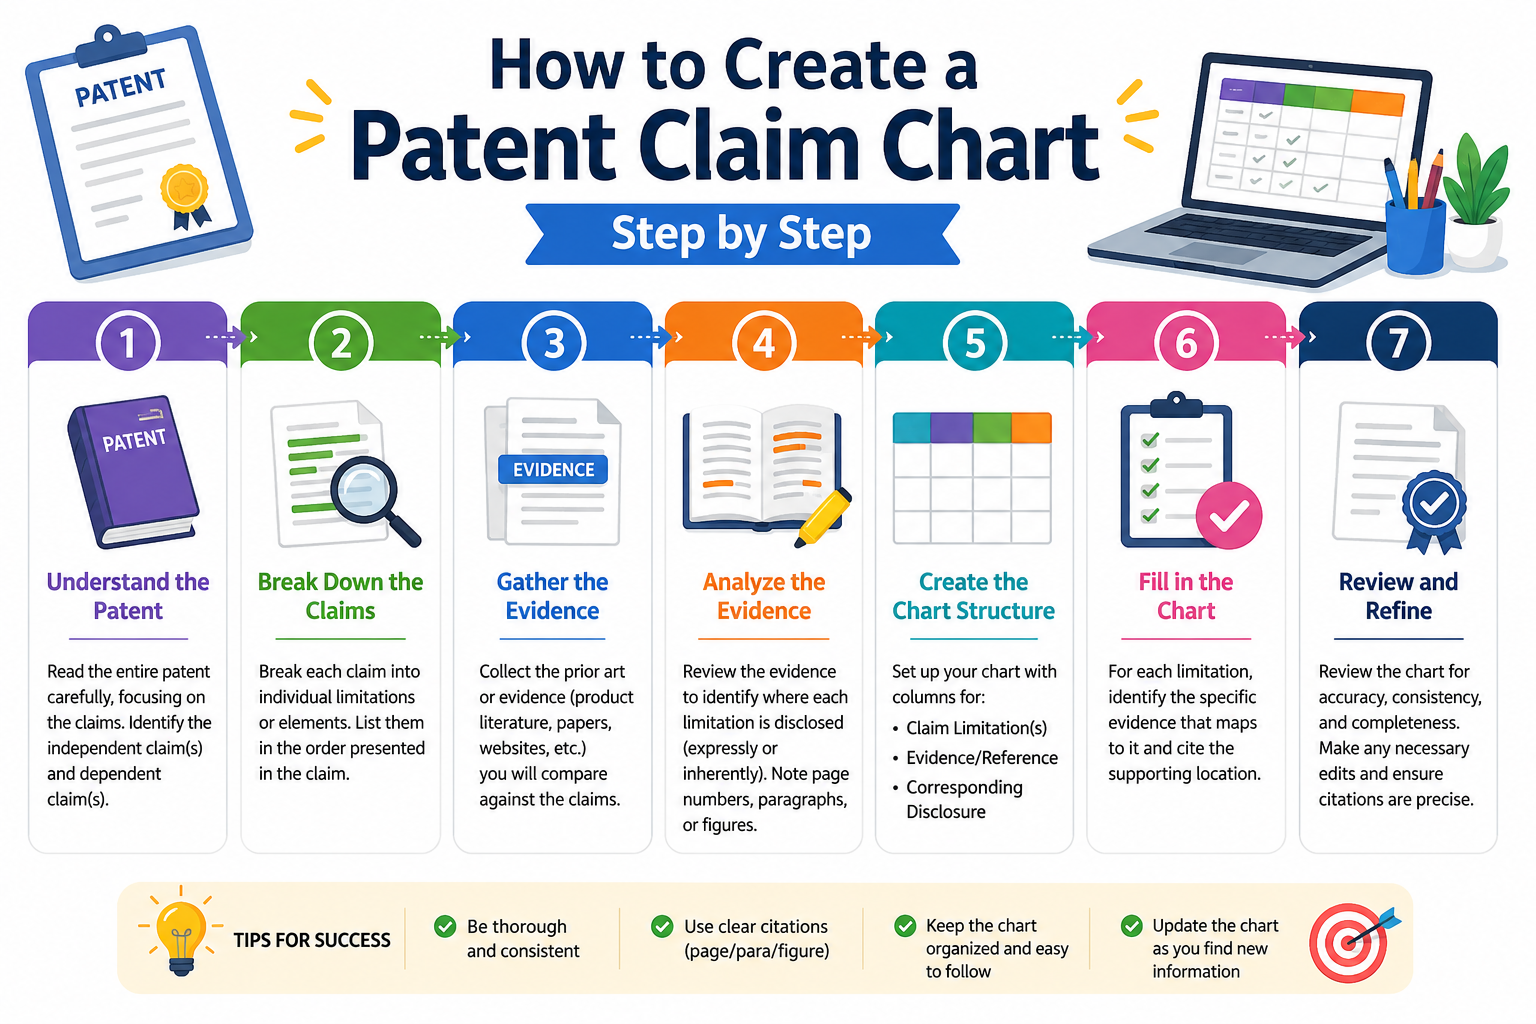
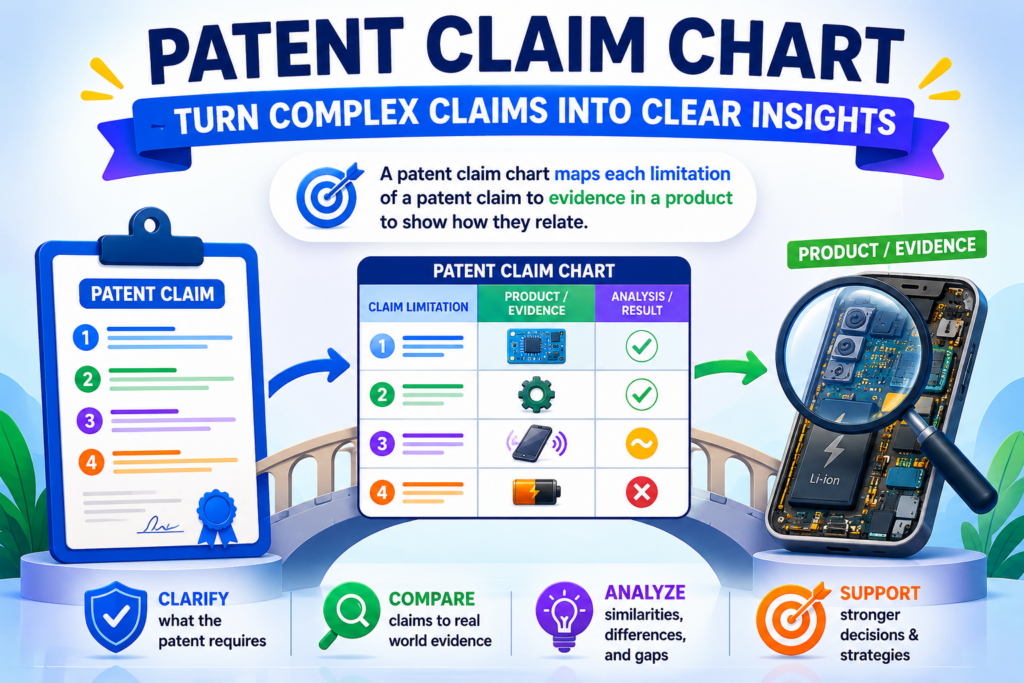
A patent claim chart sounds hard. It is not. At its core, it is a simple table that shows how each part of a patent claim matches your product, your invention, a paper, a system, or a competitor’s product. It helps you see what matters, what is missing, and where the strength of a patent really lives.
Start by knowing what a patent claim chart is really for
A claim chart is not made to look smart. It is made to make things clear. Before you build one, you need to know what job it is doing.
This matters because a weak chart can create more confusion than help. A strong chart makes the patent, the product, and the proof easy to compare.
A claim chart turns a patent claim into plain evidence
A patent claim is the part of a patent that says what the invention covers. It is usually written in a very tight way. That is good for legal use, but it can be hard for founders and engineers to read fast.
A claim chart takes that claim and breaks it into smaller parts. Then, next to each part, it shows where that part appears in a product, system, document, image, code base, model, workflow, or other proof.
Think of it like this. The claim says, “Here is what the invention includes.” The chart says, “Here is where we can see each part in the real world.”
That is why claim charts are useful. They help you move from vague thoughts to clear proof. Instead of saying, “This product looks close to our patent,” you can show exactly which part matches and where.
A good claim chart should make the reader feel calm
The best claim chart is not loud. It does not try to win by force. It wins by being clear. A person should be able to read it and understand what each claim part means, what evidence supports it, and where the gaps are.
This is where many teams make mistakes. They rush. They copy a full claim into a table and paste random screenshots beside it.
That may look like work, but it is not useful work. A chart is only helpful when each part of the claim is matched with focused proof.
If you are a founder, this matters a lot. You may need to explain your invention to a patent attorney, investor, buyer, partner, or technical team. A clean claim chart makes that conversation faster and stronger.
PowerPatent helps founders turn complex inventions into clear patent work with smart software and real attorney oversight. That means you do not have to fight through the process alone. You can see how it works here: https://powerpatent.com/how-it-works
A claim chart can help in more than one situation
Many people think claim charts are only used when there is a fight. That is not true. A claim chart can help long before there is any problem.
You can use one when you are drafting a new patent. It can help you see if your claim matches the thing you actually built. You can use one when checking a competitor product.
It can help you see whether your patent may cover what they are doing. You can also use one when studying old patents before you file, so you can understand what already exists and how your invention is different.
It can also help your team catch weak spots early. Maybe one claim part has great support, but another part has almost no proof.
Maybe the claim sounds broad, but the real product only supports a narrow version. Maybe your invention has a powerful feature that is not shown clearly in your patent materials yet.
These are the kinds of things a claim chart can reveal.
The goal is not to sound legal, but to be exact
You do not need to use big legal words to make a good claim chart. In fact, simple language often works better. The real goal is exact matching. Each claim part should be treated with care. Each piece of proof should be tied to that exact part.
For example, if a claim part talks about “receiving sensor data,” your chart should not point to a random product page that only says the system is “smart.” That is too loose.
You would want proof that shows the system receives sensor data. That proof might be a diagram, a technical document, a user guide, a code note, an API call, a demo screen, or a clear product description.
This is the mindset that makes the whole chart better. Do not ask, “Can I kind of match this?” Ask, “Where can I clearly show this?”
Read the patent claim slowly before you build the chart
The first real step is reading the claim. Not scanning it. Not guessing what it means. Reading it slowly.
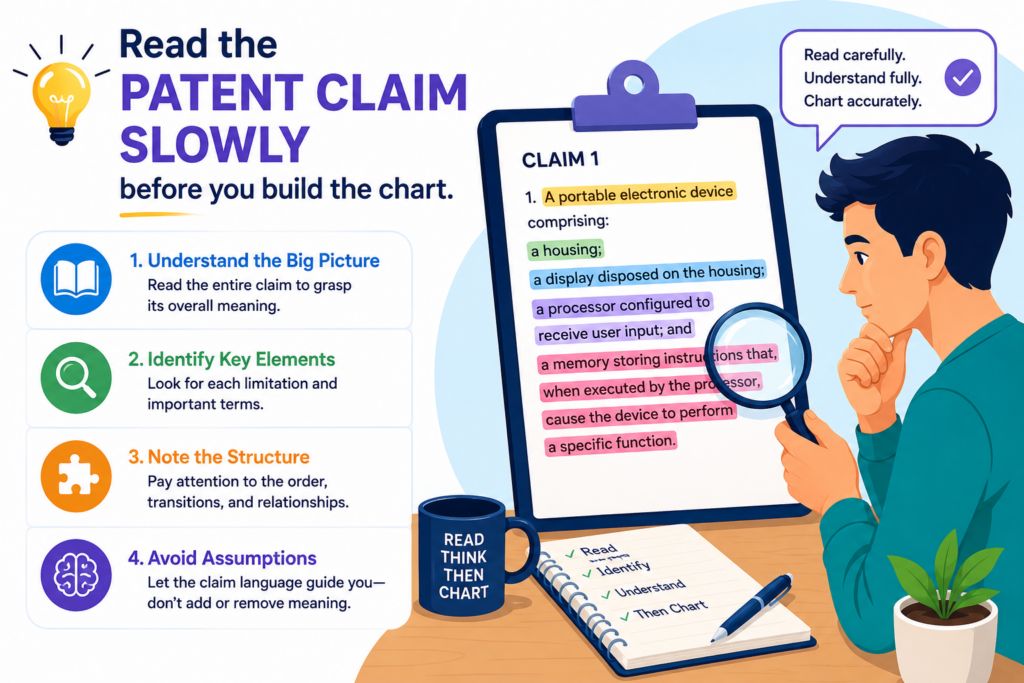
A claim chart is only as good as your understanding of the claim. If you rush this part, every later step gets messy.
Start with one claim, not the whole patent
A patent can have many claims. Some are broad. Some are narrow. Some depend on other claims. Some add small details. For your first chart, start with one claim.
Most of the time, you will begin with an independent claim. This is a claim that stands on its own. It does not rely on another claim before it. Independent claims often describe the core invention in a broad way.
Trying to chart too many claims at once can slow you down. It also makes the chart harder to read. One claim gives you a clean starting point. Once that first chart is strong, you can build more charts for other claims.
Treat the claim like a map, not like a paragraph
A claim may look like one long sentence, but it is really more like a map. Each part tells you something that must be present. Your job is to find those parts and handle them one by one.
Do not try to understand the whole claim in one breath. That is where people get stuck. Instead, read it once to get the general idea.
Then read it again and mark the key parts. Then read it a third time and ask what each part requires.
This may feel slow, but it saves time later. A messy claim read leads to a messy chart. A careful claim read gives you a chart that feels sharp from the first row.
Find the main subject of the claim
Every claim is about something. It might be a method. It might be a system. It might be a device. It might be software stored on a computer-readable medium.
It might be a model training process, a data pipeline, a sensor setup, a chip design, a user interface, or a network process.
You need to know what kind of thing the claim is covering because that shapes the evidence you need.
If the claim is about a method, your chart may need to show steps. If the claim is about a system, your chart may need to show parts that work together.
If the claim is about software, your proof may come from screens, docs, code, logs, APIs, or architecture diagrams. If the claim is about hardware, your proof may come from product photos, specs, tear-down notes, manuals, or technical drawings.
The claim type tells you where to look for proof
This is a simple but powerful habit. Before hunting for evidence, ask what kind of evidence would make sense for this kind of claim.
A method claim needs proof that actions happen. A system claim needs proof that parts exist and connect. A data claim needs proof that data is created, received, changed, stored, sent, or used.
A machine learning claim may need proof about inputs, model steps, training data, outputs, feedback loops, or deployment behavior.
When you do this, your research gets cleaner. You stop collecting random material. You start collecting the kind of proof that actually matters.
This is also where PowerPatent can help. Many founders have strong technical material, but it is spread across docs, code, slides, notes, and product specs.
PowerPatent helps turn that raw invention material into a clearer patent path with software support and real attorney review. See the process here: https://powerpatent.com/how-it-works
Break the claim into small parts that can be checked
Once you understand the claim, the next step is to break it apart. This is often called breaking the claim into elements.
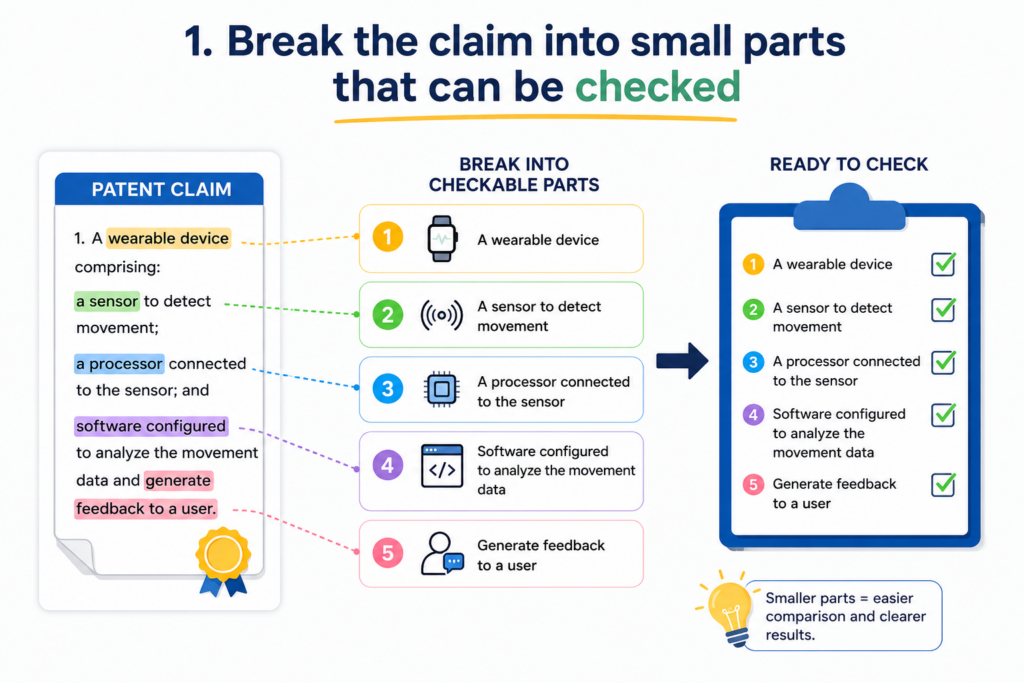
You do not need to make that sound fancy. You are simply cutting the claim into small pieces that can each be checked.
Each claim part should ask one clear question
A good claim part should be small enough that you can ask, “Is this shown in the evidence?”
If the answer is hard because the part contains too many ideas, the part is probably too big. Break it down more.
For example, a claim may say that a system receives sensor data, filters the sensor data, generates a score, and sends an alert.
If you put all of that into one row, your chart will be hard to follow. It is better to create a separate row for receiving data, filtering data, generating the score, and sending the alert.
Now each row has a job. Each row can be proven or not proven. Each row can be checked by another person without guessing.
Small parts make weak spots easier to see
This is one of the biggest reasons to break the claim down carefully. When each part has its own row, gaps become clear.
You may find strong proof for receiving data and sending an alert, but weak proof for generating the score. That tells you where to dig deeper. Maybe the proof exists in a developer doc.
Maybe it is in code. Maybe it is in a product demo. Maybe it is not public at all. Either way, the chart shows you the truth.
For founders, this is valuable because it keeps you from making broad claims without support. It also helps your patent team focus. Instead of asking, “Is our patent strong?” you can ask, “Do we have support for this exact feature in this exact claim?”
Do not change the meaning when you simplify
When you break the claim into parts, be careful not to change what the claim says. You can make the chart easier to read, but you should not rewrite the claim in a way that changes its meaning.
This is a common mistake. A person reads a claim, thinks they know what it means, and then writes a loose summary.
The problem is that patent claims often depend on exact words. A small change can change the scope.
For example, if the claim says “based on the filtered sensor data,” do not shorten it to “based on sensor data” unless you are keeping the full claim language somewhere else. The word “filtered” matters. It may be the key point.
Use the claim language as your anchor
The safest way to build the chart is to keep the real claim text in the left column. You can add a plain-English note if needed, but the claim language should stay visible.
This keeps everyone honest. It helps the founder, engineer, attorney, and reviewer look at the same words. It also prevents drift.
Drift happens when the team slowly moves away from what the claim actually says and starts charting what they wish it said.
A clean chart stays tied to the real claim. It may explain the claim in simple words, but it does not replace the claim with a guess.
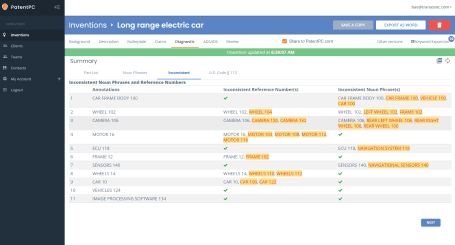
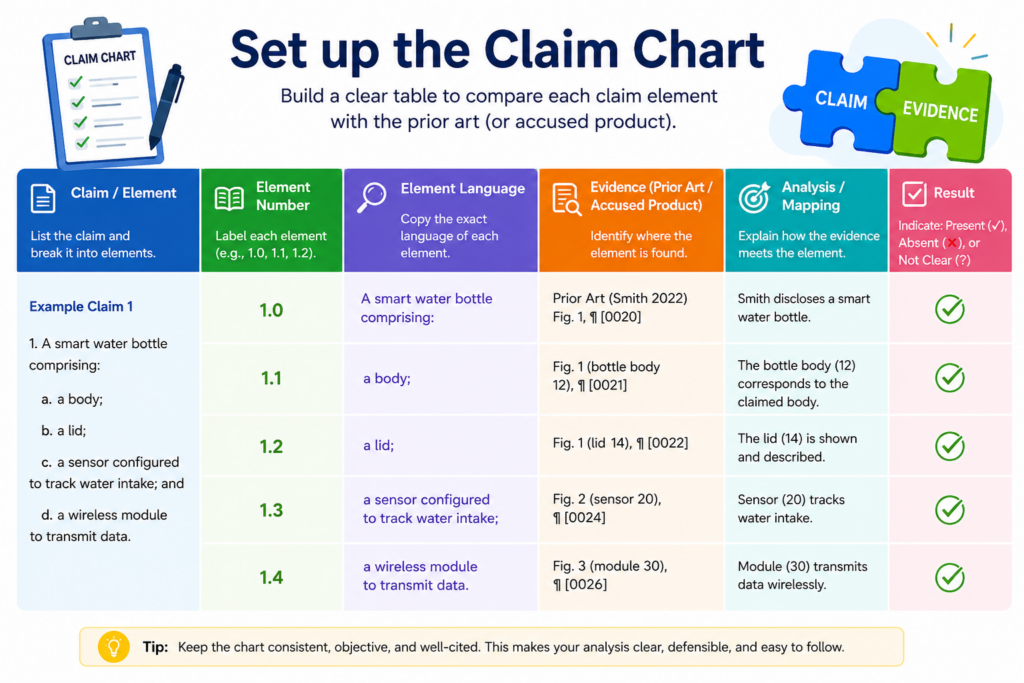
Set up the claim chart in a clean table
A claim chart works best when it is easy to read. The table does not need to be pretty. It needs to be clear. Each row should help the reader move from the claim language to the proof without getting lost.
The most common mistake is trying to put too much into the chart. When the chart becomes crowded, it stops helping. Your job is to make the chart feel simple, even when the patent claim is complex.
Use columns that keep the reader focused
At a basic level, your chart needs one column for the claim part and one column for the evidence. That is the heart of it. You can add more columns, but only when they make the chart easier to use.
A strong chart often has a column for the claim language, a column for a plain-English meaning, a column for evidence, and a column for notes. The claim language keeps the chart tied to the patent.
The plain-English meaning helps non-lawyers understand the point. The evidence column shows the match. The notes column lets you explain questions, gaps, or next steps.
The chart should answer one question at a time
Each row should make one clear match. The reader should be able to look at the claim part, look at the evidence, and understand why those two things belong together.
For example, if the claim says the system “receives image data from a remote device,” the evidence should show image data, receiving, and the remote device.
If the evidence only shows that the system handles images, that may not be enough. You may need more proof showing where the images come from.
This is why clean table design matters. A good layout forces clear thinking. It makes weak proof stand out. It also helps your patent attorney move faster because they can see what is supported and what still needs work.
Keep the exact claim text visible
It may be tempting to rewrite the claim in your own words and chart that version. Do not do that as your main source. You can include a simple meaning column, but the actual claim text should stay in the chart.
The claim text is the thing being tested. If you hide it, the chart can slowly become less accurate. Small words matter. Words like “before,” “after,” “based on,” “in response to,” “connected to,” and “selected from” can change what must be shown.
Plain language is helpful, but it should not replace the claim
A simple meaning column can be very useful for founders and engineers. It helps everyone understand what the claim is saying. But the plain meaning should support the claim text, not take over.
For example, the claim may say “generating a control signal based on the classified sensor data.” A plain note might say, “The system uses the sorted sensor data to create a command.”
That helps. But you still need to keep the original wording because “classified sensor data” and “control signal” may carry specific meaning in the patent.
This balance is important. You want the chart to be simple enough for a builder to understand, but careful enough for patent work.
PowerPatent is built for this kind of bridge. It helps technical founders move from raw invention details to cleaner patent materials, with smart software and real attorney oversight. You can see how the process works here: https://powerpatent.com/how-it-works
Choose the right target before collecting evidence
Before you start adding proof, decide what you are charting against. This is the target. The target may be your own product, a competitor product, a research paper, a public demo, a standard, an app, a device, a system, or an old patent.
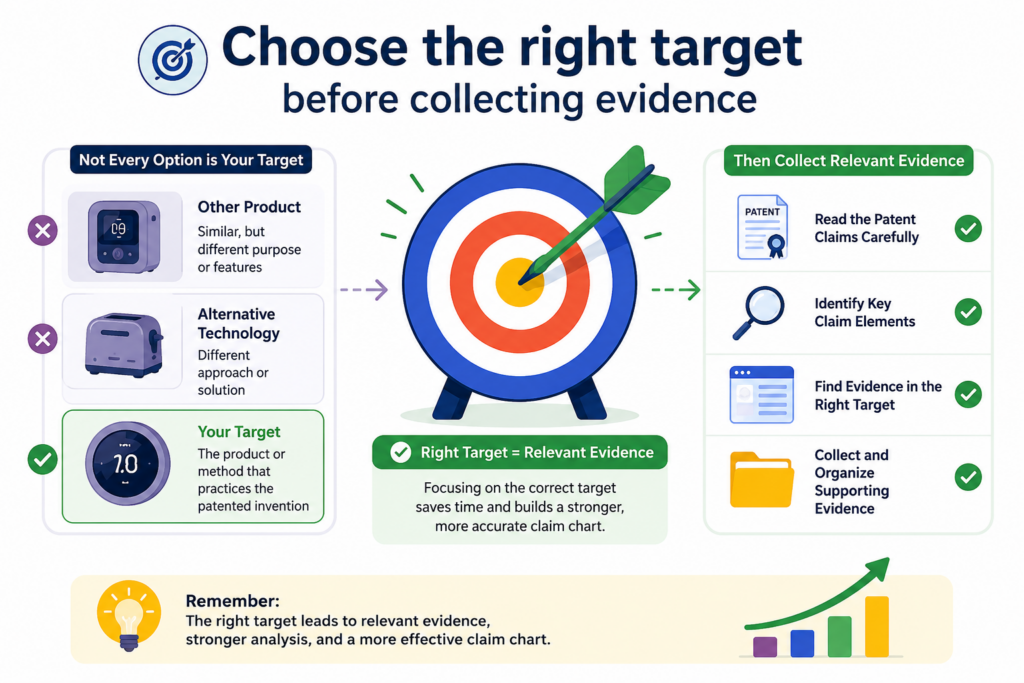
This choice changes everything. The same patent claim can look strong or weak depending on what target you compare it to.
A claim chart needs a clear target
Do not build a chart against a vague idea like “the market” or “AI tools” or “smart devices.” That is too broad. Pick one target at a time.
If you are charting your own invention, the target might be your product version, your prototype, your architecture, or your planned release.
If you are studying another company, the target might be one named product or one specific feature. If you are checking older work, the target might be one patent, one paper, or one public system.
This makes your chart cleaner because every piece of evidence points to the same thing. It also avoids a common trap: mixing proof from many places to make the chart look stronger than it is.
Do not combine unrelated proof to force a match
A weak chart often pulls one piece of proof from one product, another piece from a second product, and another from a general article.
That can create a false sense of fit. Unless your goal is to compare a claim to a combination of references, keep the chart focused on one target.
If the target is a competitor’s product, then the proof should show that product. If the target is your own system, then the proof should show your own system. If the target is a paper, then the proof should come from that paper.
This simple rule keeps the chart honest. It also makes the chart more useful. A clean chart that shows a partial match is better than a messy chart that pretends everything matches.
Match the target to your goal
The reason for the chart should guide the target you choose. If your goal is to improve your own patent filing, your target should be your invention materials.
If your goal is to understand a competitor, your target should be the competitor’s product or public material. If your goal is to study what already exists, your target should be older patents, papers, products, or public disclosures.
This is not just a paperwork choice. It affects what you learn.
When charting your own invention, you may discover that your technical team has strong features that are not yet described well.
When charting a competitor, you may discover that some claim parts are easy to show while others are hidden. When charting older work, you may find that your invention is different in a cleaner way than you first thought.
The right target saves hours of wasted work
A founder may spend days reading patents and product pages without knowing what they are trying to prove. That is painful and slow. A clear target gives the work a sharp edge.
Before you collect evidence, write down the target in plain words. Name the product, version, document, system, or feature. Then keep the whole chart tied to that target.
For example, “Version 2 of our edge AI sensor platform” is clear. “Competitor X mobile app payment flow as shown in the March 2026 help docs” is clear. “Public white paper on robotic arm calibration published by Company Y” is clear.
The more exact the target, the stronger the chart becomes.
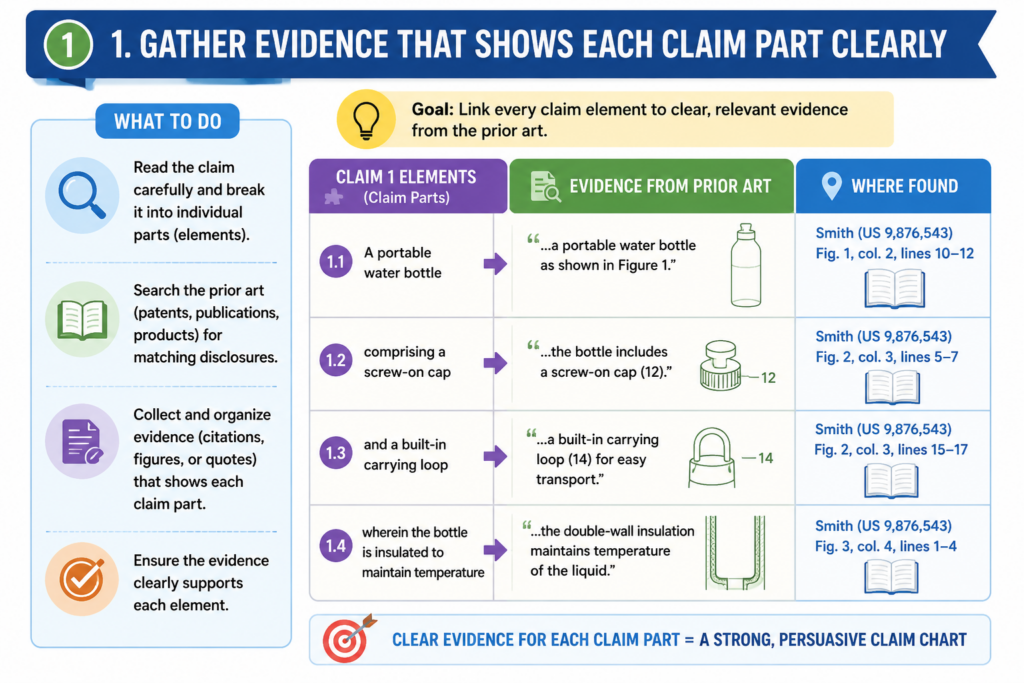
Gather evidence that shows each claim part clearly
Now comes the part most people think of first: collecting evidence. But notice that it comes after reading the claim, breaking it down, setting up the table, and choosing the target. That order matters.
If you collect evidence too early, you may gather lots of material that looks useful but does not answer the claim. When you collect evidence after you understand the claim, your work becomes faster and more focused.
Look for proof that directly matches the claim language
Good evidence is not always the longest document or the most technical file. Good evidence is the proof that shows the claim part clearly.
If the claim part is about receiving data, look for proof of receiving data. If the claim part is about training a model, look for proof of training.
If the claim part is about sending a command to a device, look for proof that the command is sent and that a device receives it.
This sounds simple, but it is where many charts fall apart. People add general product descriptions instead of direct proof. A general statement like “our system uses AI to improve performance” does not prove much by itself.
A screenshot showing the model output, a code note showing the input pipeline, or a system diagram showing the flow may be much stronger.
Strong evidence should reduce guessing
When someone reads your evidence, they should not have to guess why it matters. You should guide them.
Do not paste a large block of text and hope they find the answer. Quote or describe the exact part that matters. If you use a screenshot, explain what the reader should notice. If you use a diagram, name the box, arrow, step, or module that maps to the claim part.
For your own product, evidence may come from design docs, Git notes, product specs, internal demos, test results, system logs, slide decks, architecture maps, user flows, or technical notes.
For another product, evidence may come from public pages, manuals, demos, app screens, videos, support docs, developer docs, patents, papers, press materials, or product filings.
The form of the evidence matters less than the clarity of the match.
Keep track of where every piece of proof came from
A claim chart without sources is weak. Even if the evidence looks good, the reader needs to know where it came from.
This is especially true when the chart may be reviewed later by an attorney, investor, acquirer, partner, or technical lead.
For every piece of evidence, capture the source. That may be a file name, URL, page number, document title, screenshot date, version number, or internal folder path. If the target changes over time, note the date you captured it.
This is practical, not fancy. Product pages change. Apps change. Docs move. Screens get redesigned. A source note helps you prove what you saw and where you saw it.
Evidence without context can lose value fast
Imagine you paste a screenshot into a chart. It looks perfect today. Six months later, nobody knows where it came from, what version it showed, or whether the feature was live or mocked up. That proof becomes harder to trust.
Now imagine the same screenshot has a short source note: product demo, version 1.8, captured on a clear date, showing the alert settings screen. That is much better.
This is also useful when working with a patent team. Attorneys can move faster when they do not have to chase every source.
Engineers can answer questions faster when the chart points back to exact materials. Founders can make better choices because the chart is based on traceable proof.
PowerPatent helps founders bring invention material into a clearer workflow so important details do not get lost in scattered docs and rushed calls.
Learn how PowerPatent helps turn technical work into stronger patent filings here: https://powerpatent.com/how-it-works
Write the evidence notes in a way that explains the match
Finding evidence is not enough. You also need to explain why it matches the claim part. This is where the chart becomes useful. The explanation does not need to be long, but it does need to be clear.
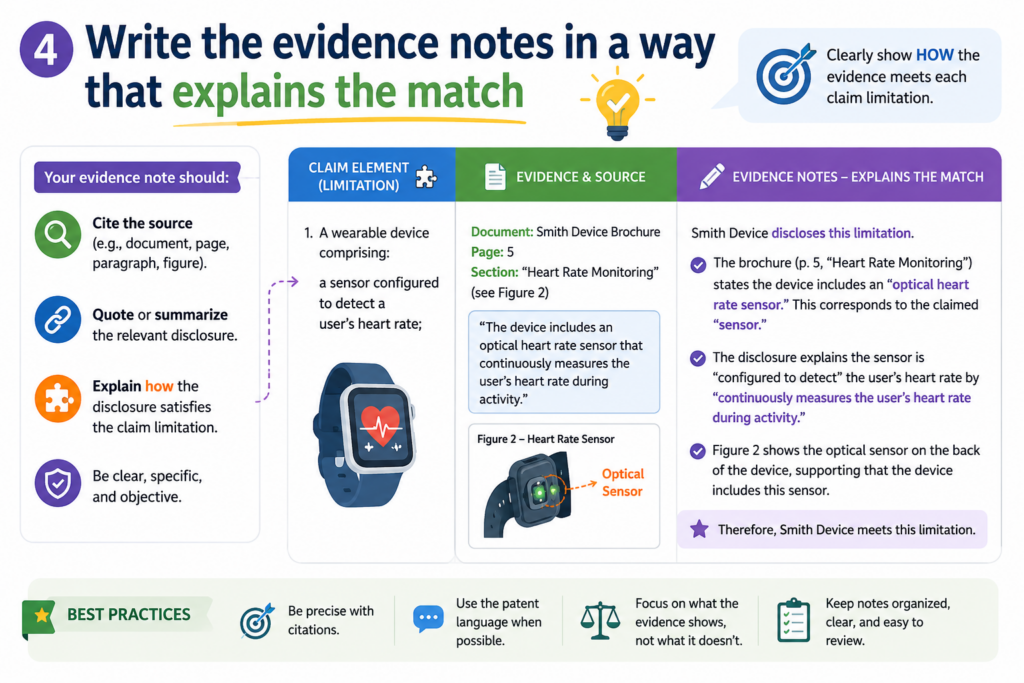
A good evidence note connects the dots. It says what the evidence shows and how that supports the claim part. It does not make the reader do all the work.
Avoid vague evidence notes
Weak notes use broad words. They say things like “this is shown here” or “the product does this” or “see screenshot.” That is not enough. The reader still has to figure out what you mean.
A better note explains the exact match. It might say that the diagram shows the mobile device sending image data to the cloud service.
It might say that the API document shows a request that includes sensor readings. It might say that the product guide describes an alert being sent after the system detects a fault.
The goal is to make the connection obvious.
Use simple words, but be exact
You do not need legal language to write a strong evidence note. In fact, clear simple words are often better. But simple should not mean loose.
For example, do not write, “This part is about data.” That is too broad. Write what kind of data, where it comes from, what happens to it, and how that lines up with the claim.
If the claim says the system “filters the sensor data to remove noise,” your note might explain that the technical document describes a smoothing step that removes sudden spikes from the sensor readings before the readings are used by the model.
That is plain language, but it is also precise.
This is the tone you want across the whole chart. Clear. Calm. Direct. No drama. No guessing.
Separate facts from assumptions
Sometimes the evidence will not show everything directly. That is normal. Public evidence may be thin. Internal documents may be incomplete. A product may clearly do something, but the exact process may be hidden.
When that happens, do not pretend. Mark the gap. Say what the evidence shows, and say what still needs to be confirmed.
For example, a public page may show that a device gives a health score, but it may not explain whether that score is generated from filtered sensor data.
Your chart should say that the score is shown, but the filtering step is not confirmed by that source.
Honest gaps make the chart stronger
It may feel risky to admit gaps, but it actually makes the chart more trustworthy.
A chart that claims everything is perfect when the evidence is weak will not hold up well. A chart that clearly separates strong proof from open questions is much more useful.
This matters for founders. You do not want false confidence. You want real confidence. You want to know where your patent position is strong, where your filing needs more support, and where your team should collect more invention detail.
That is one reason PowerPatent combines smart software with real attorney oversight. The goal is not just to create more patent paperwork.
The goal is to help founders protect what they are building with more speed, more clarity, and fewer costly misses. See how it works here: https://powerpatent.com/how-it-works
Map each claim part to proof without forcing it
A strong claim chart is not about making every row look good. It is about showing the truth clearly. Some claim parts will match well.
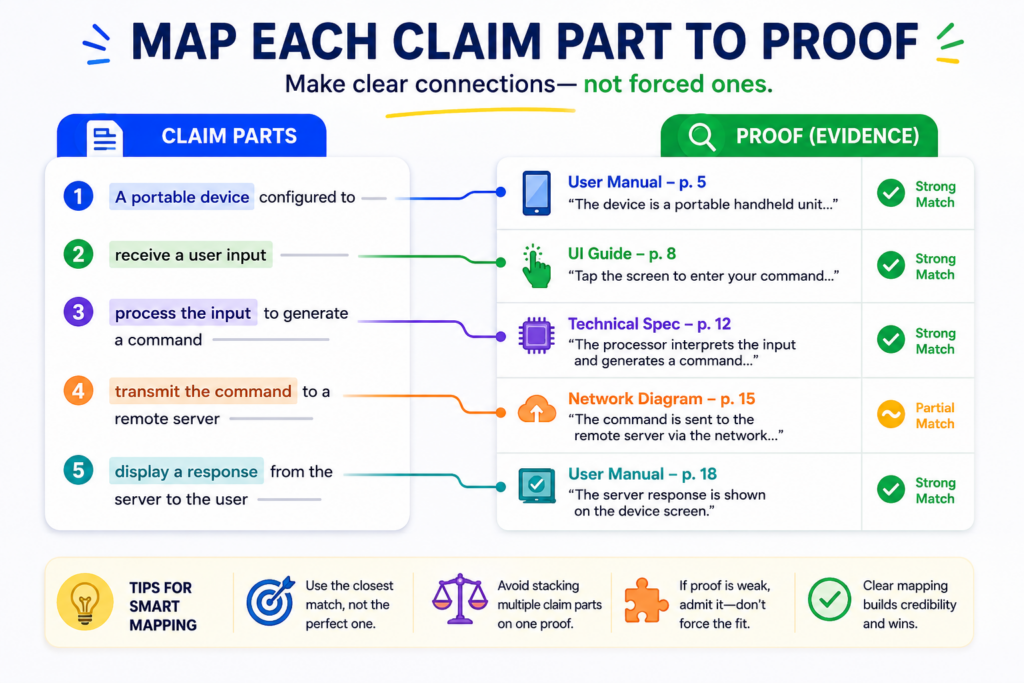
Some will only partly match. Some may not match at all. That is fine. The value of the chart comes from seeing the real picture.
When you force a match, the chart becomes weak. It may look complete, but it will not help your team make smart choices.
A founder needs clear ground, not wishful thinking. A patent attorney needs facts, not guesses. An engineer needs to know what must be shown, fixed, or explained.
A match should be direct enough to explain in plain words
For each row, ask a simple question: does the proof show this claim part in a clear way? If yes, explain how. If no, say what is missing. If the answer is maybe, write that it needs more review.
This may feel basic, but it is powerful. Claim charts often become messy because people want a yes or no answer too fast. Real technical products are not always that simple.
A feature may be present, but hidden. A system may do the claimed step, but only in some versions. A model may create an output, but the public docs may not say how.
Your chart should handle that with care. The chart should not hide doubt. It should name the doubt so the next step becomes clear.
A clean partial match is better than a fake full match
A partial match can still be useful. It may show that a product has some parts of a claim but not others. It may show that your own invention is close to being well supported, but needs more detail in the patent draft.
It may show that a competitor’s public material suggests a match, but more proof is needed before anyone can be confident.
For example, suppose a claim part says the system “generates a risk score based on a trained model and sends a warning to a user device.” The target proof may show the risk score and warning, but not the trained model.
That is not a full match. Your chart should say the score and warning are shown, while the trained model part is not confirmed by the current proof.
That kind of honesty saves time. It keeps your team from building plans on weak ground.
Use the same matching standard across the whole chart
Do not be strict in one row and loose in another. That makes the chart hard to trust. Try to use the same level of care from start to finish.
If one row needs direct proof, then other rows should also need direct proof. If you allow a reasonable technical reading in one place, be clear about why.
This does not mean every row must have the same type of evidence. It means the thinking should be steady.
A screenshot may be enough for a user interface feature. A public API page may be enough for a data input. A system diagram may be enough to show how modules connect.
But when the claim talks about hidden steps, such as model training or backend filtering, you may need deeper proof.
Your chart should show both confidence and caution
A useful chart lets the reader feel where the case is strong and where it is thin. You can do this with short notes in plain English. You might write that the evidence directly shows the feature.
You might write that the evidence suggests the feature but does not prove the full step. You might write that no clear evidence has been found yet.
This kind of note helps everyone. It helps your attorney know what to review. It helps engineers know what documents to pull. It helps founders decide whether to file, revise, investigate, or move faster.
PowerPatent helps founders make this process less painful by turning technical details into cleaner patent work, supported by smart software and real attorney review. You can explore the process here: https://powerpatent.com/how-it-works
Add context so the claim chart can stand on its own
A claim chart should not need a long meeting to make sense. A person should be able to open it later and understand what was compared, what proof was used, and what the chart is trying to show.
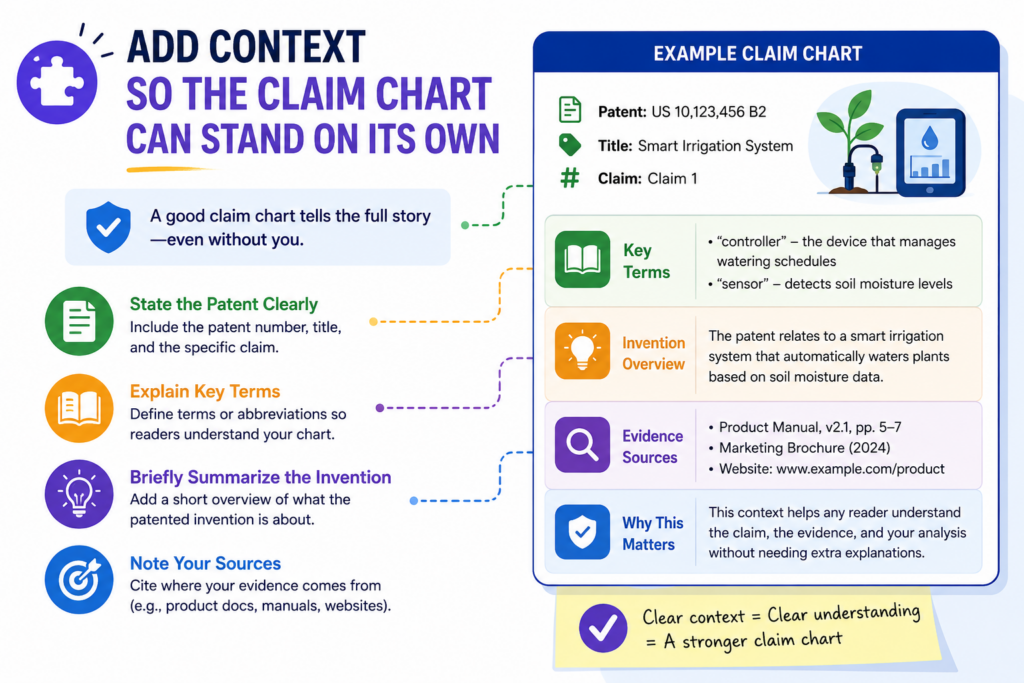
This is where context matters. Context is the small amount of background that keeps the chart from feeling like a pile of disconnected rows. It tells the reader what they are looking at and why it matters.
Give the chart a short purpose statement
At the top of the chart, include a simple purpose statement. It should say what patent claim is being charted and what target it is being compared against.
It should also say whether the chart is for drafting support, product review, competitor review, prior art study, or internal planning.
This does not need to be long. In fact, it should not be long. A few clear sentences are enough. The goal is to stop confusion before it starts.
For example, the chart may explain that it compares claim 1 of a patent application to the company’s current prototype.
Or it may explain that it compares a granted patent claim to public materials for a named product. Or it may explain that it studies a research paper to see which parts of the claim are already known.
The purpose keeps the reader from using the chart the wrong way
A chart made for invention drafting is not the same as a chart made for a competitor review. A chart made from public evidence is not the same as a chart made from internal documents. If the purpose is unclear, people may treat the chart as stronger than it is.
This can create bad decisions. A founder may think a chart proves more than it does. An engineer may think a gap means the feature does not exist, when it only means the proof has not been found. A reviewer may miss that the chart was built from old product material.
A short purpose statement helps prevent that. It sets the frame. It tells the reader how to read the work.
Add version details when the target may change
Products change. Software changes. Models change. Public docs change. Even your own invention may change as the team builds. This is why version details matter.
If you are charting your own product, name the product version or prototype stage. If you are charting a competitor product, note the date you reviewed the public material.
If you are charting a document, include the title and date if you have it. If you are charting source code or internal docs, include enough detail so the source can be found later.
Version notes protect the value of your work
A chart without version details can become hard to use after a few months. Nobody remembers which build was reviewed.
Nobody knows whether a screenshot came from a live product, a test build, or a sales mockup. Nobody knows whether the public page later changed.
That is easy to avoid. Add the context while the work is fresh. A small note today can save hours later.
This is especially important for fast-moving startups. Your product may change every week. Your model may improve every sprint. Your hardware design may shift after testing. If your patent work does not keep up with the real invention, gaps can form.
PowerPatent helps founders keep patent work closer to the actual build process, so key details are less likely to be missed. See how PowerPatent works here: https://powerpatent.com/how-it-works
Review the claim chart like an engineer and a founder
Once your first draft is done, do not treat it as finished. A claim chart needs review. The first pass is where you collect and map.
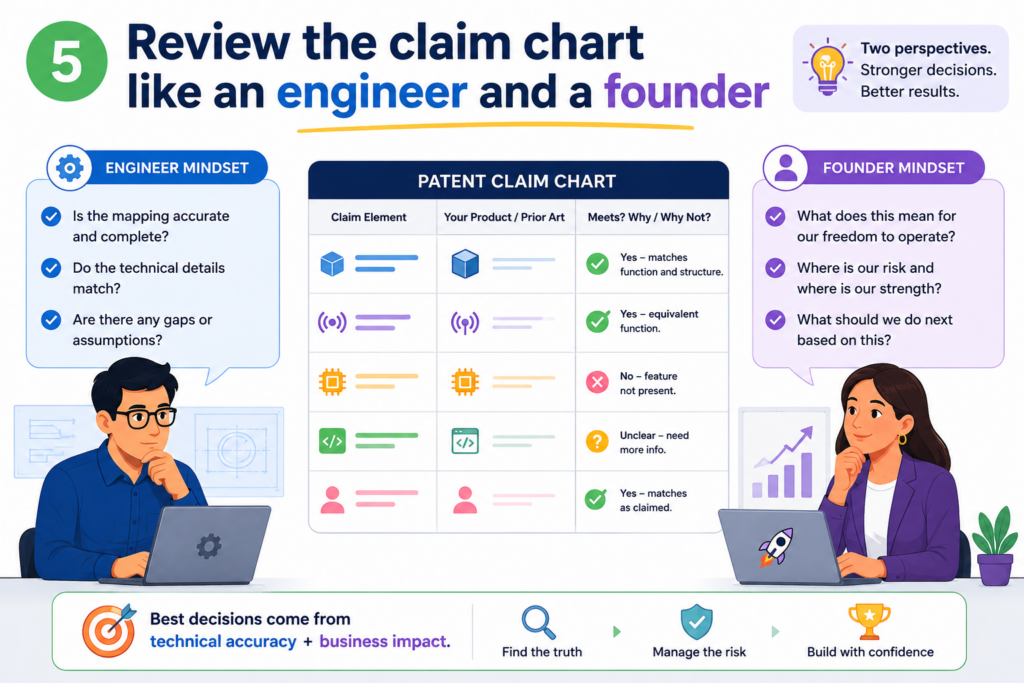
The second pass is where you sharpen. This is where good charts become great charts.
You want to review the chart from two angles. First, review it like an engineer. Is the technical match real? Second, review it like a founder. Does this chart help us make a better decision?
Check whether the technical story is true
Start by looking at each row and asking whether the evidence really supports the claim part. Do not ask whether you want it to support the claim. Ask whether it actually does.
This is where engineers can be very helpful. They can spot when a chart uses the wrong term, points to the wrong module, or assumes a step that does not happen. They can also help find better proof.
Sometimes the first evidence is weak, but a stronger source exists in a design doc, test note, code comment, architecture diagram, or product spec.
A founder does not need to know every deep technical detail, but the chart should be checked by someone who understands the product well enough to catch mistakes.
The best charts are built with technical truth, not sales language
Sales pages often describe what a product does in broad terms. That can be useful, but it may not be enough. Patent claims often need more exact support. A chart that relies only on high-level marketing words may miss the real technical match.
For example, a page may say a system “uses smart automation.” That does not tell you much.
The claim may require receiving sensor readings, classifying those readings, selecting a control action, and sending a command. The chart needs proof for those parts, not just broad language.
This is why founder-led patent work should include the people who built the thing. They know what happens under the hood. They can help turn fuzzy claims into clear technical support.
Ask whether the chart supports a real decision
After checking the technical side, step back. What does the chart tell you? Does it show that the claim is well supported by your invention?
Does it show that your draft needs more detail? Does it show that a target product only matches some parts? Does it show that more research is needed?
A claim chart should lead to action. It should not just sit in a folder.
Maybe the action is to add more invention detail before filing. Maybe it is to write a new claim that better captures the strongest feature. Maybe it is to gather screenshots or product logs.
Maybe it is to ask an attorney to review a specific row. Maybe it is to stop chasing a weak theory and focus elsewhere.
A chart is only valuable when it changes what you do next
The best claim charts make the next step obvious. They show where the proof is strong. They show where it is missing. They show which features matter most. They also help your team talk in a more focused way.
Instead of saying, “We need better patent coverage,” you can say, “Our current draft covers the alert workflow, but it does not clearly capture the model feedback loop.”
That is a much better conversation. It is specific. It is useful. It gives the attorney and technical team something real to work with.
PowerPatent is designed for founders who want that kind of clarity without slowing down the company.
It combines smart tools with real attorney oversight, so your ideas can move from raw technical work to stronger patent protection with less friction. Learn more here: https://powerpatent.com/how-it-works
Fix weak rows before you rely on the chart
Every claim chart has weak rows at first. That is normal. The mistake is not having weak rows. The mistake is ignoring them.
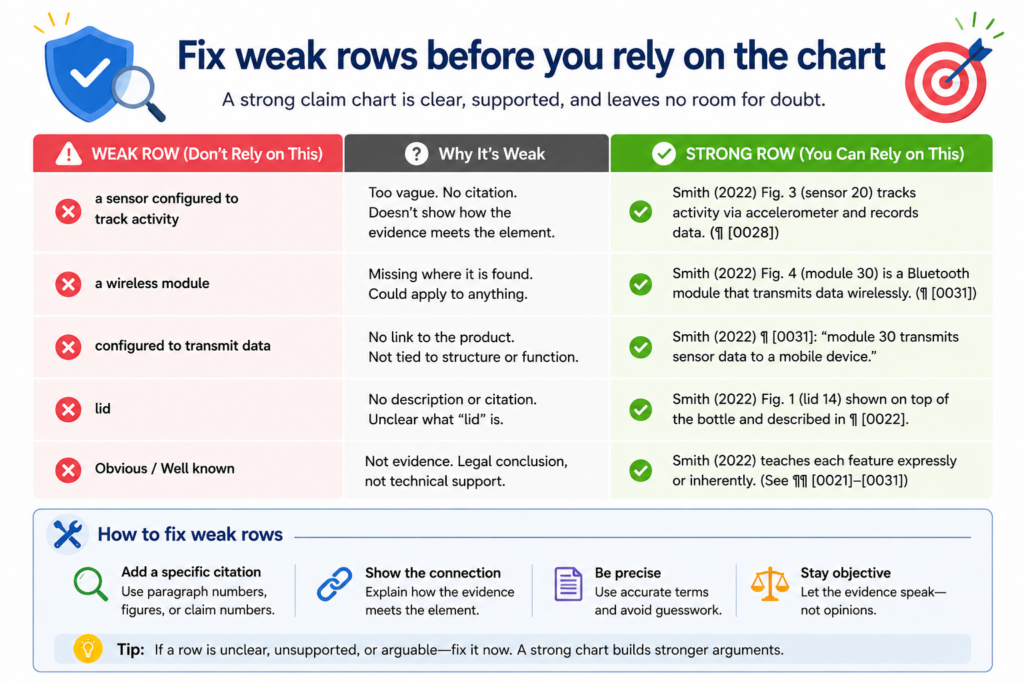
A weak row is a row where the claim part is not clearly supported. It may have vague evidence, missing sources, unclear logic, or a match that depends on too much guessing. Before you rely on the chart, you should fix as many weak rows as you can.
Find the weak rows by reading only the evidence column
One useful test is to read the evidence column by itself. Do not look at your intent. Do not fill in missing facts from memory. Just read what the evidence says.
If the evidence does not clearly show the claim part, the row needs work. If the source is hard to find, the row needs work.
If the note uses words like “probably,” “likely,” or “seems,” the row may need deeper review. Those words are not always bad, but they signal that the proof may be thin.
Weak rows often point to missing invention detail
When you are charting your own invention, a weak row may not mean the invention is weak. It may mean the invention has not been explained well enough yet.
This is common in startups. The team knows how the system works, but the details live in Slack threads, code comments, notebooks, diagrams, or someone’s head. The patent materials may not capture the best parts yet.
A claim chart can expose that gap. That is a gift. It gives you a chance to collect the right details before filing or before your next patent draft is locked in.
It helps you avoid the painful moment where everyone realizes too late that the most important feature was not described clearly.
Replace weak proof with better proof when possible
Once you find weak rows, go back and look for stronger evidence. Try to find proof that is closer to the actual claim language. A direct technical document is often better than a broad web page.
A labeled architecture diagram may be better than a vague slide. A dated product spec may be better than a memory from a meeting.
When working with your own invention, ask the builders where the feature is shown. They may know exactly where to look.
When working with public materials, search for manuals, developer docs, support pages, demo videos, patents, papers, or product screenshots that show the feature more clearly.
Do not be afraid to mark a row as unresolved
Some rows will stay weak. That is not a failure. It is useful information.
Mark the row as unresolved and explain what is missing. Maybe you need code review. Maybe you need a product demo. Maybe you need a technical expert. Maybe public evidence is not enough. Maybe the claim does not fit the target as well as expected.
This is how a careful team works. You do not need to force the chart to look perfect. You need it to be useful. A clear unresolved row is far better than a polished row that hides a problem.
Use the claim chart to improve your patent draft
A claim chart is not only useful after a patent is filed. It can be even more useful before you file. This is where founders can save real time and avoid painful mistakes.
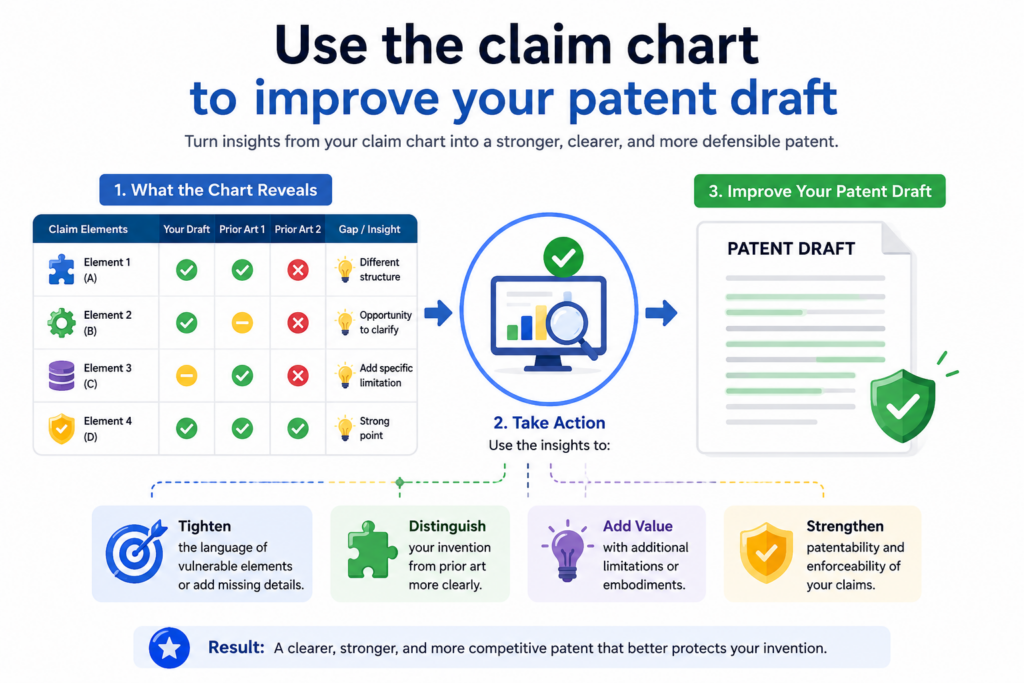
When you use a chart while drafting, you can see whether the patent language truly matches the invention your team has built.
Many patent drafts sound strong at first. But when you chart the claims against the real product, you may notice that the wording is too broad, too narrow, or not aimed at the best part of the invention.
That is not a small issue. The claims are the core of the patent. If they miss the real value, the patent may look nice but fail to protect what matters.
A claim chart can show whether your claim covers the real invention
The chart forces you to compare the claim to the actual invention. This is important because patent work can drift away from the product if the process is not grounded in real technical facts.
Founders often explain the invention in a fast meeting. Engineers may share a few docs. A patent draft gets written.
But the deepest value may be hidden in the system design, model flow, data handling, control logic, training method, device setup, or backend process. A claim chart helps bring those hidden parts into the open.
When you map each claim part to your own product, you can see if the patent is pointing at the real breakthrough. You may find that the claim covers the general workflow but misses the special step that makes your product better.
You may find that the claim includes a feature your product no longer uses. You may find that the claim is written around an early prototype, while the real invention has moved forward.
Your patent draft should follow the strongest technical truth
The strongest patent work starts with the real invention, not with generic wording. A claim chart helps you stay close to that truth.
For example, your team may have built a system that does more than send alerts. Maybe it learns from how users respond to those alerts. Maybe it changes thresholds over time.
Maybe it cuts false alarms by using a special filter before the model runs. If the claim only says “send an alert,” it may miss the deeper value.
The chart helps you spot that. It gives you a way to say, “This claim covers the basic output, but it does not capture the adaptive feedback step.” That one insight can lead to a much stronger draft.
This is where PowerPatent can help founders move faster without losing the details.
The platform helps turn technical work into clearer patent materials, with smart software and real attorney oversight. You can see how it works here: https://powerpatent.com/how-it-works
A claim chart can help you avoid claims that are too narrow
A narrow claim may be easy to match to your product, but it may not give you the protection you want. If every row of the chart only matches one exact design choice, ask whether the claim is tied too closely to the current version.
Startups change fast. Your first version may use one model, one sensor, one data format, one device, or one workflow.
Six months later, the product may use something better. If your patent claim is locked to the first version, it may not cover where the company is going.
The chart can help you see that early. If a claim part depends on a detail that is not central to the invention, it may be worth asking whether the claim should be written in a broader way.
The chart should help you protect the idea behind the build
This does not mean you should make vague claims. It means your claim should focus on the real inventive idea, not random details.
For example, maybe the invention is not the exact database you use. Maybe it is the way your system selects which data to store after a device event. Maybe the invention is not the exact screen layout.
Maybe it is the way the system changes the user flow based on risk. Maybe the invention is not one type of sensor. Maybe it is the way multiple weak signals are joined to make a better decision.
A claim chart can help your team separate core invention details from build choices. That is a big deal.
It helps your attorney draft claims that are more useful, more focused, and less likely to become outdated as your product grows.
Use the claim chart to study competitor products carefully
A claim chart can also help you look at competitor products in a calm and structured way. This does not mean jumping to legal conclusions.
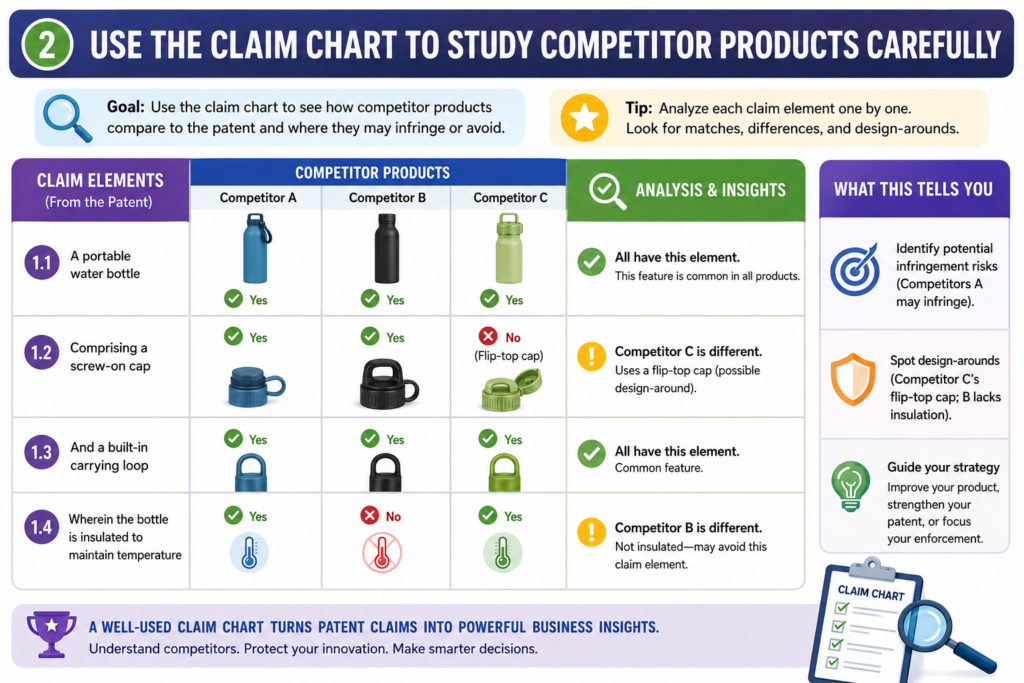
It means organizing public facts so your team can understand what is visible, what is hidden, and what still needs review.
Founders often notice that a competitor has launched something similar. The first reaction may be stress. The second reaction may be guesswork.
A claim chart gives you a better path. It helps you slow down, compare carefully, and avoid making big claims based on thin proof.
Start with public facts, not assumptions
When charting a competitor product, use facts you can point to. Public sources may include product pages, support docs, demos, videos, manuals, developer pages, app screens, technical papers, patents, job posts, or public talks. The key is to stay grounded.
Do not write that a competitor does something just because it would make sense for them to do it. If the source does not show it, say that it is not confirmed. This keeps the chart honest and more useful.
A competitor may describe an outcome, such as better predictions, faster setup, or safer control.
But the claim may require a specific step behind that outcome. Public material may not reveal that step. Your chart should make that clear.
Public proof often shows the outside, not the inside
Many important technical steps happen behind the scenes. A public page may show what the user sees, but not how the system works.
A demo may show an alert, but not how the alert is created. A dashboard may show a score, but not the data pipeline that produced it.
This is why competitor claim charts often contain open questions. That is normal. The chart is still valuable because it shows which parts are visible and which parts are not.
For example, you may be able to show that a competitor app receives device data and displays a result. But you may not be able to show whether it filters the data before scoring.
You may not know whether the model is trained in a certain way. You may not know whether the system uses a feedback loop. Those rows should be marked with care.
Avoid emotional language when reviewing competitors
A competitor chart should sound calm. Do not write it like a sales attack. Do not use loaded words. Do not stretch the evidence. The more neutral the chart is, the stronger it becomes.
This matters because the chart may be reviewed by attorneys, executives, investors, or technical experts. They need clear facts, not anger. A clean chart helps them make good decisions.
Instead of saying, “They copied our feature,” the chart should say what the public proof shows. It may say that the competitor’s support page describes a device sending temperature readings to a cloud dashboard.
It may say that a demo video shows a warning sent to a mobile phone after the reading crosses a threshold. That is more useful than a big claim with weak support.
The chart should help your team decide what to do next
A competitor chart may lead to several next steps. Your team may decide to ask a patent attorney for review. You may decide to collect more public evidence.
You may decide to improve your own filings. You may decide that the match is too weak to worry about. You may decide that your strongest claim is not the one you first thought mattered.
The point is not to panic. The point is to gain control.
PowerPatent is built for founders who want that kind of control. It helps turn technical work and invention notes into stronger patent filings, backed by smart software and real attorney oversight. You can learn more here: https://powerpatent.com/how-it-works
Use the claim chart to compare your invention against older work
Before filing a patent, you also need to understand what already exists. A claim chart can help with that too.
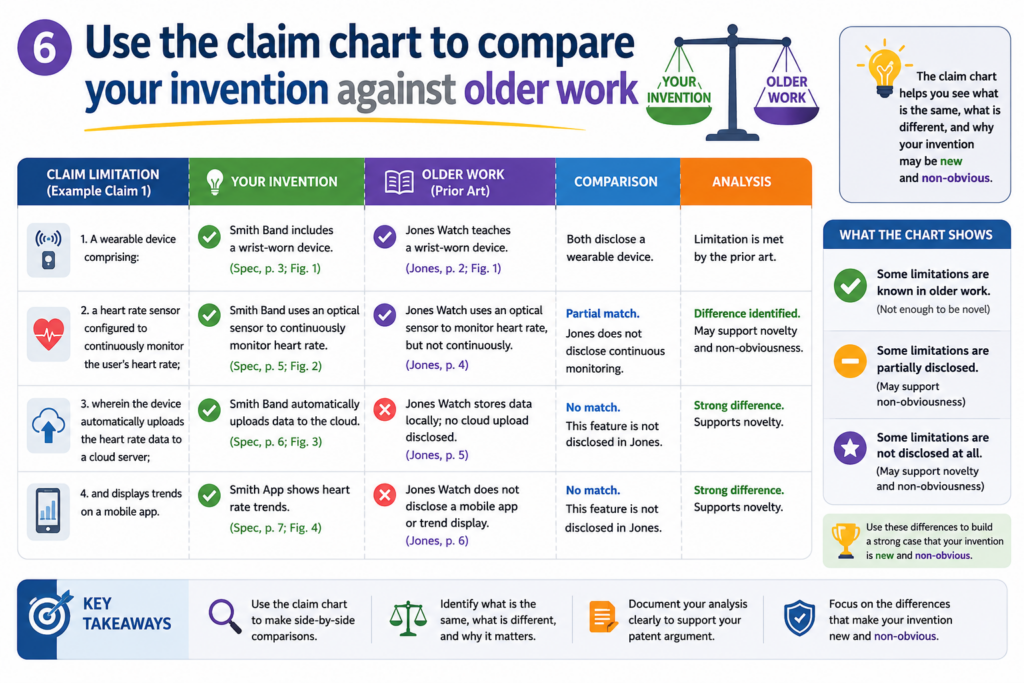
This kind of chart compares your claim or invention idea against older patents, papers, products, posts, standards, or public technical materials.
The goal is not to scare yourself. The goal is to see the field clearly. When you understand what came before, you can better explain what makes your invention new and useful.
Older work can shape better patent claims
When you chart older work, you may find that some parts of your idea are already known. That is not the end of the road.
Most strong inventions build on things that already exist. The key is to find the part that is different and important.
A claim chart can help you do that. It shows which claim parts are found in the older work and which parts are not. That gap may point to your real invention.
For example, an older paper may show collecting sensor data and sending it to a cloud system. But it may not show your special way of cleaning the data before model training.
An older patent may show a robot adjusting its path. But it may not show your way of using live force data and user feedback together. An old product may show a dashboard. But it may not show the adaptive decision engine behind your tool.
The difference should be clear enough to explain simply
A useful patent story is not just, “Our invention is better.” Better is too broad. You need to explain how it is different.
A claim chart gives you the raw material for that story. It helps you say, “Older systems did this, but they did not do that.” That kind of contrast is easier to understand and easier to use in drafting.
This is especially helpful for deep tech startups. Your invention may be complex, but the difference can often be explained in simple terms once the evidence is organized. The chart helps you find that simple explanation.
Do not ignore older work that feels close
It can be tempting to avoid close references because they feel uncomfortable. That is a mistake. The closer the older work is, the more useful it may be. A close reference can help you sharpen your claims.
When a chart shows that older work includes many parts of your idea, do not panic. Look carefully at what is missing.
That missing part may be the key. It may show where your invention improves speed, accuracy, safety, cost, control, scale, privacy, or reliability.
A close reference can also help your attorney avoid writing claims that are too easy to reject. If you know what the older work shows, you can draft around it with more care.
Strong patent work faces the hard comparison early
The best time to find close older work is before filing, not after. Early review gives your team time to adjust the draft, add detail, and focus the claims on the strongest part of the invention.
This is where many startups lose time. They file quickly without enough structure. Later, they learn that the claims were aimed at something too broad or already known. That can lead to delays, extra cost, and weaker protection.
A claim chart helps reduce that risk. It turns a scary pile of older material into a clear comparison. It gives your team a better way to talk about what is truly new.
PowerPatent helps founders handle this process with more speed and less confusion. Instead of trying to turn scattered technical notes into a patent alone, you get software support plus real attorney oversight.
See how PowerPatent helps founders file better patents here: https://powerpatent.com/how-it-works
Build an evidence file before the chart gets too large
As your claim chart grows, the table can become hard to manage. This is normal. A detailed chart may include many claim parts, many sources, many screenshots, and many notes.
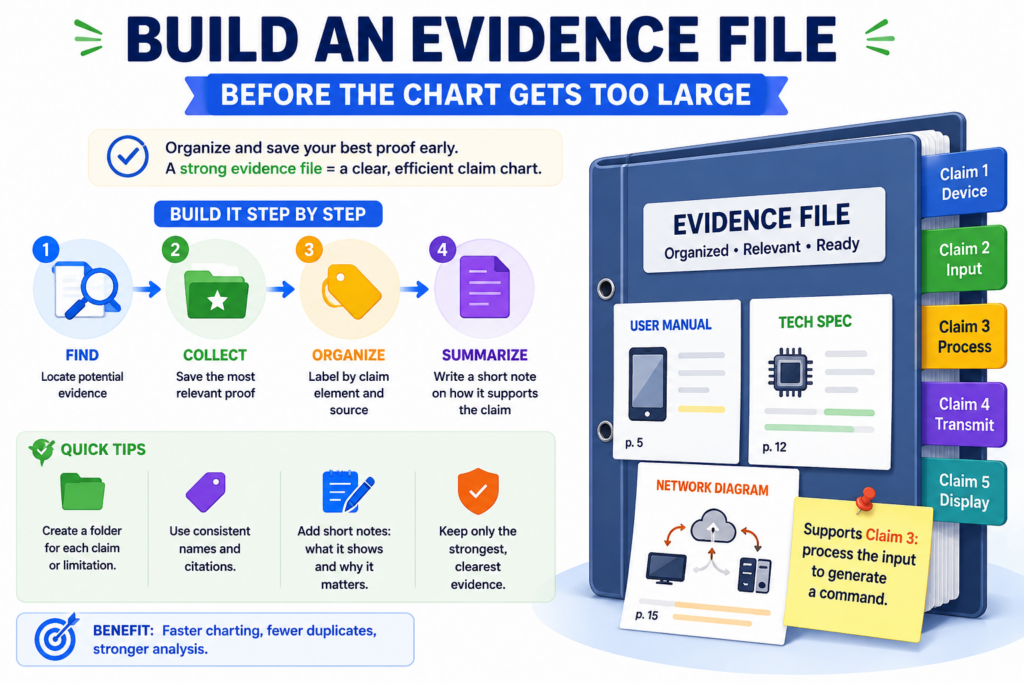
If you do not organize the evidence early, the chart can turn into a messy folder of loose proof.
A clean evidence file solves this. It gives every source a home. It also makes the chart easier to review because the reader can move from the chart to the proof without hunting through emails, folders, links, or old screenshots.
Keep the chart clean and store heavy proof outside it
A claim chart should show the key match. It should not become a storage room for every full document. If you paste too much into the chart, the chart becomes slow to read. It also becomes harder to update.
A better way is to keep the table focused and place larger proof in a separate evidence file or folder.
The chart can include the source name, the key excerpt, the page number, the screenshot label, or the file reference. Then the full evidence stays nearby for deeper review.
This helps your team move faster. A founder can read the chart and understand the main point. An engineer can open the source file and check the technical detail. An attorney can review the proof without asking the team to resend everything.
Name your evidence in a way that people can understand later
Bad file names cause pain. A folder full of files called “screenshot1,” “notes final,” or “doc latest” will confuse everyone. Use names that explain what the file is.
A useful name might include the product, feature, source type, and date. For internal work, it may include the prototype version or sprint name. For public materials, it may include the company name, page title, and capture date.
This is not busywork. It protects the value of the chart. When someone opens the chart six months later, they should be able to find the proof quickly. That can matter during patent drafting, investor review, diligence, licensing talks, or a later dispute.
Use labels that connect the chart to the evidence file
Each piece of evidence should have a simple label. The chart can then refer to that label. This keeps the table clean while still making the proof easy to find.
For example, you may label a screenshot as “EV-03” and describe it as the mobile alert screen captured from prototype version 2.1.
In the chart, the evidence note can refer to EV-03 and explain what the screenshot shows. The full screenshot stays in the evidence file.
This is a small habit that makes the whole process feel more professional. It also helps reduce mistakes. People can talk about the same source without confusion.
A simple evidence system can save your team from repeat work
Without labels, teams often repeat the same research. One person finds a source. Another person cannot find it later. A third person takes a new screenshot. Soon the chart has duplicate evidence and no clear trail.
A basic evidence file avoids that. It creates one shared place where proof lives. It also makes the claim chart easier to update when the product changes or new documents appear.
PowerPatent helps founders bring order to invention work that often starts in scattered notes, code, docs, and team calls.
With smart software and real attorney oversight, the path from invention detail to patent filing becomes much clearer. You can see how it works here: https://powerpatent.com/how-it-works
Write claim chart notes that are clear enough for a busy founder
A claim chart should not feel like homework. It should help a busy person understand the issue fast.
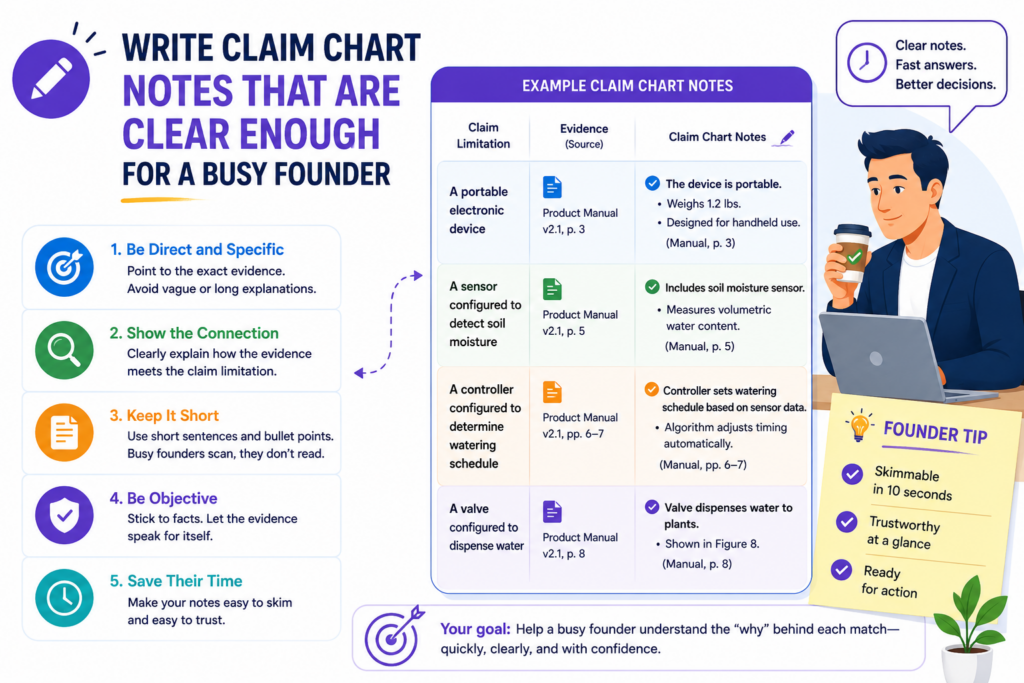
That means your notes must be simple, focused, and useful. Long notes are not always better. Dense notes can hide the point.
The best notes do three things. They tell the reader what the claim requires. They show what the evidence says. They explain whether the match is strong, partial, or still unclear.
Make each note do real work
Do not write notes just to fill space. Every note should help the reader see the match more clearly. If a sentence does not explain the claim, the evidence, or the gap, cut it.
A good note may be only a few sentences, but it should be specific. For example, it may explain that the source shows the device collecting pressure readings and sending those readings to a server before the risk score is created.
That tells the reader what happens, where it happens, and how it relates to the claim.
A weak note would say the source “shows data processing.” That phrase is too broad. It does not tell the reader what data is used, what processing happens, or why it matters.
Use the same words when the same idea comes back
Claims often repeat related ideas. The chart may mention sensor data, filtered data, training data, output data, and user feedback. If you keep changing the words without reason, the reader may get confused.
Use steady language. If the claim says “sensor data,” keep saying “sensor data” unless you need to explain a narrower type. If the claim says “control signal,” do not call it a “message,” “command,” and “instruction” in different rows unless those words truly mean different things in the system.
This is not about sounding stiff. It is about reducing friction. The reader should spend energy thinking about the invention, not guessing whether your words mean the same thing.
Keep legal conclusions out of basic chart notes
A chart note should explain facts. It should not jump too quickly into legal conclusions. For most founders, the safer habit is to write what the evidence shows and leave final legal judgments to the attorney.
For example, rather than writing that a product “infringes claim 1,” the chart can say that a public document appears to show the product receiving sensor data, generating a risk score, and sending a warning, while the model training step is not shown by the current source.
That is more useful. It gives the attorney something concrete to review. It also keeps your team from treating a draft chart like a final answer.
Clear facts help attorneys move faster
A patent attorney can do a better job when the chart is grounded in facts. They can review the claim language, compare the evidence, and advise on the strength of the match.
But if the chart is full of guesses and strong claims without support, the attorney has to spend more time untangling it.
This is one reason a well-built claim chart can save money and time. It makes the conversation sharper. It helps the legal review focus on the real issues.
PowerPatent is built around this same idea. Founders should not have to choose between moving fast and doing patent work carefully.
PowerPatent combines smart tools with real attorney oversight so the process feels clearer and less painful. Learn more here: https://powerpatent.com/how-it-works
Use screenshots with care and explain what they show
Screenshots can be very helpful in a claim chart. They can show a screen, a setting, a result, a warning, a workflow, or a product feature in a way that words alone cannot. But screenshots can also be weak if they are used without context.
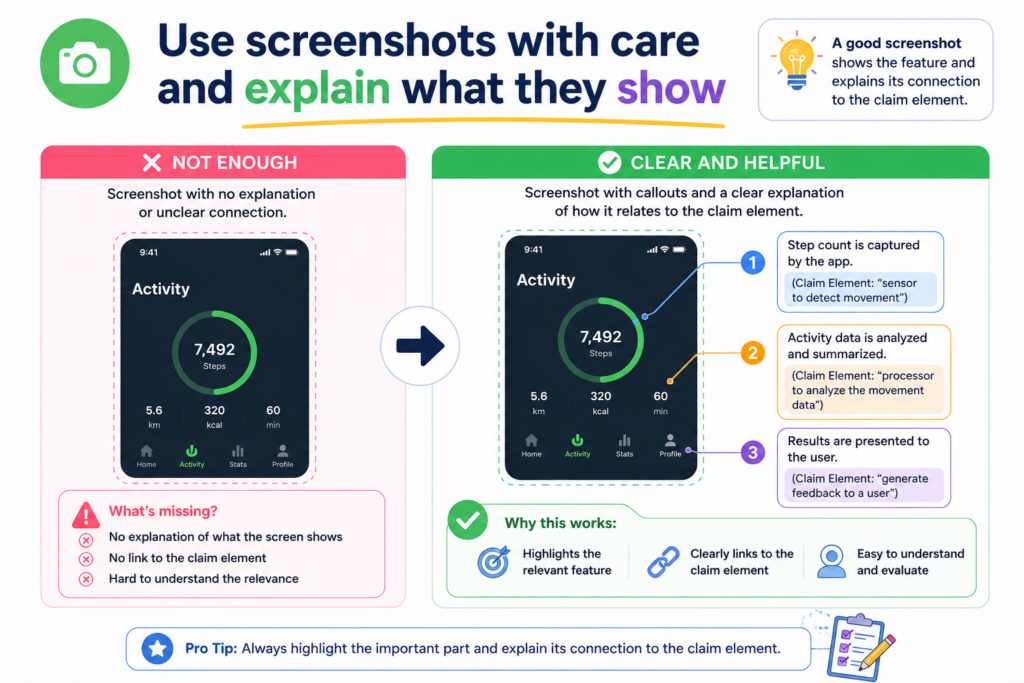
A screenshot is not magic proof. It only helps if the reader can understand what it shows and how it connects to the claim part.
Capture the full context, not only the pretty part
When you take a screenshot, try to include enough surrounding detail so the source is clear. A tiny cropped image may show one word or one icon, but it may not show where it came from. That can make it harder to trust later.
For a product screen, include the page title, feature name, menu label, or other visible context when possible. For a public webpage, capture the page title and date if you can.
For an app screen, note the product version if known. For an internal demo, note whether the screen comes from a prototype, test build, or live product.
This kind of context makes the screenshot more useful. It helps the reviewer see that the image is tied to a real source and not just a loose picture.
A screenshot should have a short caption in plain words
Do not make the reader guess what to notice. Add a short caption or evidence note that explains the key point.
For example, the caption may say that the screen shows the user receiving a warning after the device reports a high temperature reading.
Or it may say that the dashboard shows the risk score generated for the selected machine after sensor data is uploaded.
That note gives the screenshot meaning. Without it, the reviewer may not know which part of the image matters.
Do not use screenshots to prove hidden steps unless they really show them
Screenshots are often good for visible features. They can show a button, alert, result, setting, chart, upload screen, dashboard, or user flow. But they may not prove what happens behind the scenes.
For example, a screenshot may show a risk score. It may not prove how the score was generated. It may not prove that a trained model was used.
It may not prove that the data was filtered first. If the claim requires those hidden steps, you need more proof.
This is where many charts become too loose. The screenshot shows an output, and the note assumes the whole backend process.
That is risky. The better approach is to say exactly what the screenshot shows and mark the hidden part as needing more support.
Visible proof and backend proof often need to work together
For software and AI inventions, a strong chart may need both visible proof and backend proof. A screenshot can show the user-facing result.
A technical document, architecture diagram, API record, code note, or model workflow can show how that result is made.
When both types of proof line up, the chart becomes much stronger. The reader can see the user experience and the technical process behind it.
This is especially important for startups working with AI, robotics, sensors, chips, biotech tools, developer platforms, cybersecurity, or complex software.
The most valuable part of the invention is often not the screen. It is the system behind the screen. Your chart should help bring that system into view.
Use technical documents to support the parts the user cannot see
Screenshots are useful, but many important claim parts happen behind the screen. This is especially true for software, AI, hardware systems, data tools, cloud platforms, robotics, and medical devices.
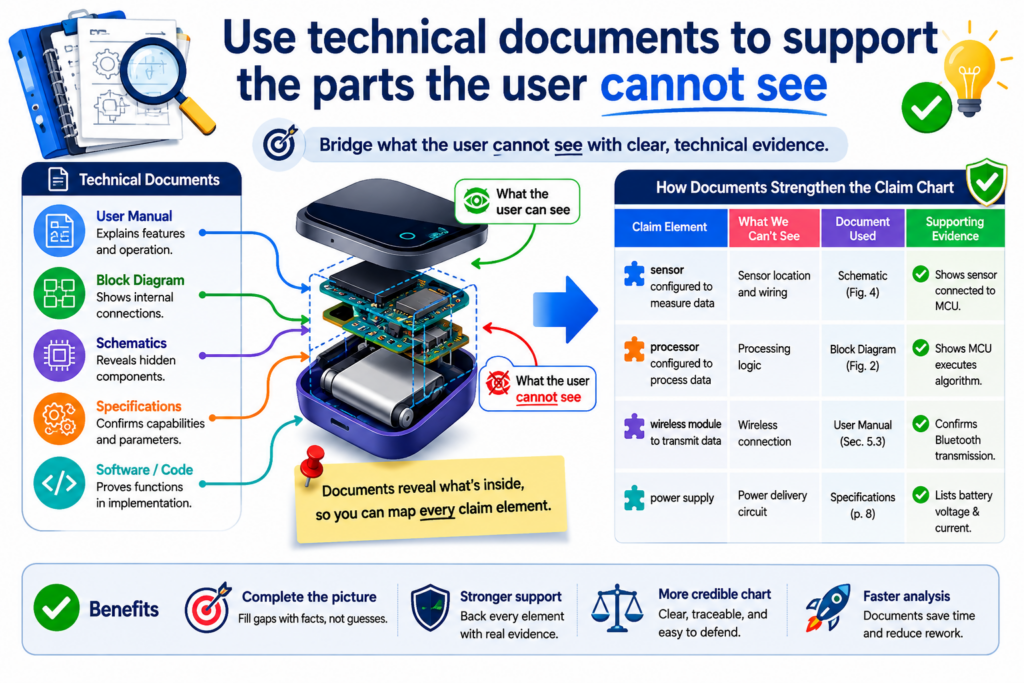
A user may only see an output, but the claim may depend on the way the system creates that output.
That is why technical documents matter. They can show the steps, parts, signals, models, rules, and flows that are not visible from the outside.
Internal documents can make your own claim chart much stronger
When you chart your own invention, you often have access to better proof than any public source could offer.
You may have product specs, system diagrams, design notes, model cards, test logs, architecture maps, code comments, API docs, device drawings, lab notes, or sprint tickets.
These materials can help show what the invention really does. They can also help your patent team write claims that match the real technical work.
For example, a public product page may say your tool “predicts failures before they happen.” That sounds nice, but it is not enough for a strong claim chart.
An internal architecture document may show that the system receives vibration data, filters out noise, compares the cleaned signal to a trained model, creates a risk score, and sends a warning to an operator. That is much stronger.
The best evidence is often already inside the company
Many founders think they need to create brand-new patent materials from scratch. Often, the key details already exist. They are just spread across the company.
The problem is that startup knowledge is messy. Some details are in code. Some are in notebooks. Some are in slide decks. Some are in Slack. Some are in the mind of the engineer who built the first version. A claim chart helps pull that knowledge into one clear view.
This is one of the biggest ways founders can avoid costly patent mistakes. If the best technical detail is never captured, the patent may miss the strongest part of the invention.
PowerPatent helps founders bring those details into the patent process with smart software and real attorney oversight. You can see how it works here: https://powerpatent.com/how-it-works
Public technical sources can help when reviewing outside products
When charting a competitor product or older work, you may not have internal documents. But public technical sources can still help.
Look beyond the main sales page. The deeper proof may be in developer docs, user manuals, API pages, white papers, patents, standards, conference talks, support articles, integration guides, or product videos.
These sources may show more than the homepage. A support guide may explain a workflow. A developer page may show data fields. A manual may show device connections.
A patent filing may describe technical features related to the product. A standards document may show how a system must behave to comply.
Better sources can change the whole chart
A weak row may become strong when you find the right document. A claim part that looked unsupported on a marketing page may be clearly shown in a user guide.
A hidden data step may appear in an API schema. A device connection may be shown in an installation manual.
This is why you should not stop at the first source. Claim charting is often about finding the clearest proof, not the fastest proof.
At the same time, be careful. A source must still connect to the target you are charting. Do not use a general technical article to prove what one product does unless the article clearly applies to that product. Keep the source tied to the target.
Handle AI and software claim charts with extra care
AI and software inventions can be hard to chart because the most valuable work is often invisible.
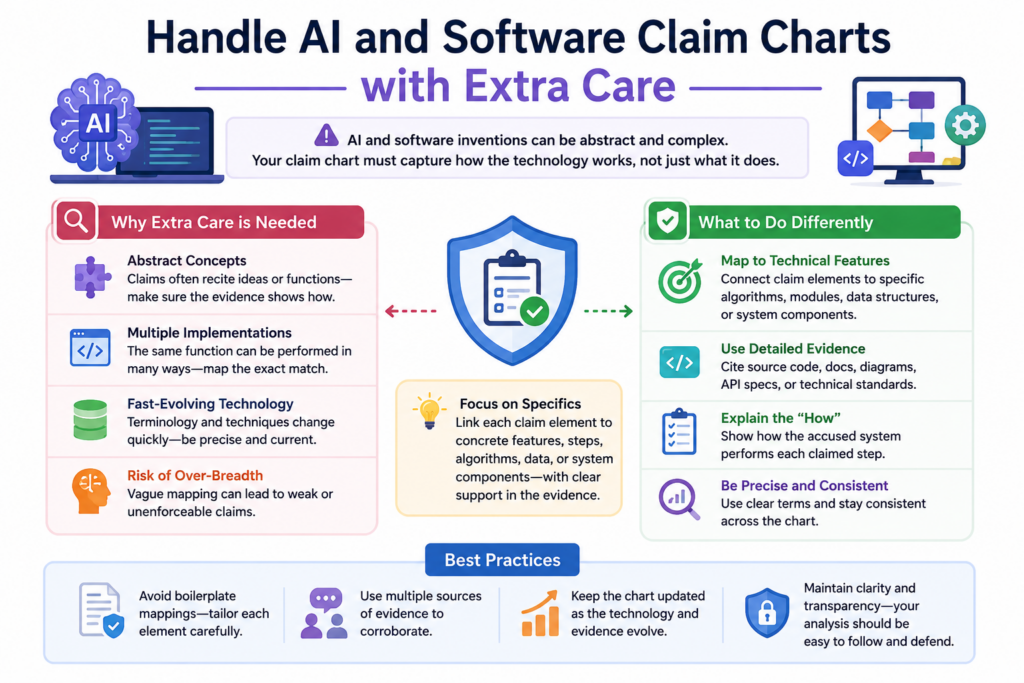
The user may see a prediction, result, prompt response, search result, alert, ranking, or dashboard. But the claim may require a certain data flow, model step, training process, rule engine, or feedback loop.
This does not mean AI and software charts must be confusing. It means you need to be more careful about what the proof shows and what it does not show.
Break the software workflow into real steps
Do not treat software as a black box. A claim chart becomes much clearer when you break the workflow into real actions.
Ask what data comes in, what the system does with it, what decision is made, what output is created, and what happens after that output.
For AI tools, also ask whether the claim is about training, inference, ranking, filtering, embedding, classification, generation, feedback, or deployment. These are different parts of the system. A chart should not blur them together.
For example, a claim about training a model is not the same as a claim about using a trained model. A chart that proves the system gives predictions may not prove how the model was trained.
A chart that shows a chatbot response may not prove how documents were retrieved or ranked before the answer was generated.
The chart should not hide the difference between input, model, and output
A strong AI chart keeps the flow clear. It shows the input data, the model or logic step, and the output. If feedback is part of the claim, it also shows how the feedback is captured and used.
This helps prevent sloppy matching. It is easy to say, “The system uses AI, so this claim part is met.” That is not enough. The chart should explain what the AI receives, what it does, and what it produces.
For founders, this is a huge chance to improve patent quality. Many AI patents fail to capture the real edge because the invention is described too broadly.
Your edge may be in the data cleaning, the feature selection, the model update, the user feedback loop, the privacy layer, the ranking method, or the deployment setup. The chart helps you find and protect that edge.
Use product behavior and technical proof together
For software, product behavior can show what the system does from the user side. Technical proof can show how it happens behind the scenes. When both are available, use both.
For example, a screen may show that the system recommends a next action. A technical document may show that the recommendation is based on a score created from real-time device data.
A log may show that the score is updated after each new event. Together, these sources tell a stronger story.
AI inventions need clear support before filing
AI teams move fast. Models change. Pipelines change. Features change. That speed can create patent gaps if the filing does not capture the right version of the invention.
A claim chart can help your team slow down just enough to protect the important parts. It can show what the product does today, what the patent draft says, and what details still need to be added.
PowerPatent is designed for founders building complex technology who need strong patents without losing momentum.
It helps turn technical details into clearer patent work, backed by real attorney oversight. Learn more here: https://powerpatent.com/how-it-works
Do not let the claim chart become a wall of text
A claim chart should be detailed, but it should not be painful to read. There is a difference between being complete and being crowded.
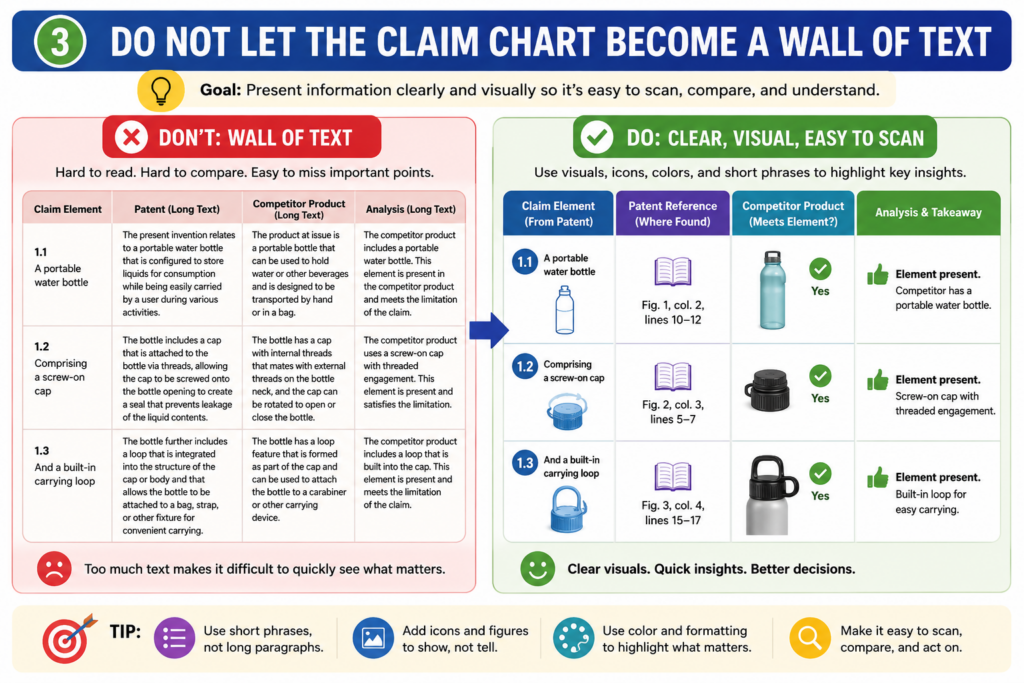
A crowded chart makes the reader work too hard. A clean chart helps the reader understand fast.
This is important because claim charts are often read by busy people. Founders, engineers, attorneys, investors, and business teams do not have time to decode a messy document. They need the point, the proof, and the gap.
Use short paragraphs inside the table
Even when the claim is complex, your notes should be easy to scan. Keep each evidence note focused on the exact claim part. Do not paste long blocks of source text unless the full passage is truly needed.
A better approach is to use a short quote or summary, then explain the match in plain words. The full source can live in the evidence file. The chart should carry the useful part, not the whole document.
This keeps the chart readable. It also makes review easier. A person can move row by row and understand what is being shown.
Dense charts slow down good decisions
When a chart is too dense, people start skipping. They miss gaps. They miss weak rows. They may also miss the strongest proof because it is buried under too much text.
A clean chart helps the best points stand out. It also makes the weak points easier to fix. This is not just a design choice. It affects the quality of the decision that comes next.
For example, if a founder can quickly see that three claim parts are well supported and one claim part is weak, the next step is clear.
The team can focus on the weak row. If that same issue is buried in five pages of copied text, the team may miss it.
Put detailed backups in a separate place
You do not need to delete detail. You just need to put it in the right place. The chart should show the key match. The evidence file should hold the full backup.
This way, the chart remains useful for quick review, while the proof remains available for deeper review. That balance is what makes the chart practical.
A clean chart helps your patent attorney help you
Patent attorneys need detail, but they also need structure. A clear chart helps them see the invention faster. It helps them ask better questions. It helps them find the claim parts that need more support.
That can save time. It can also improve the final patent filing. Instead of spending time trying to understand scattered materials, the attorney can focus on the core invention and the best way to protect it.
PowerPatent gives founders a better way to move from raw invention work to cleaner patent filings.
The mix of smart software and real attorney oversight helps reduce friction while keeping quality high. You can see the process here: https://powerpatent.com/how-it-works
Conclusion
A strong patent claim chart does not need to be confusing. It needs care, proof, and clear thinking. When you break each claim into small parts, match each part to real evidence, and mark gaps honestly, you give your team better control. You can improve your patent draft, study competitors, compare older work, and avoid costly surprises.
Most of all, you can protect the real value behind what you are building. PowerPatent helps founders turn complex inventions into stronger patent filings with smart software and real attorney oversight. See how it works here: https://powerpatent.com/how-it-works and start with more confidence today.